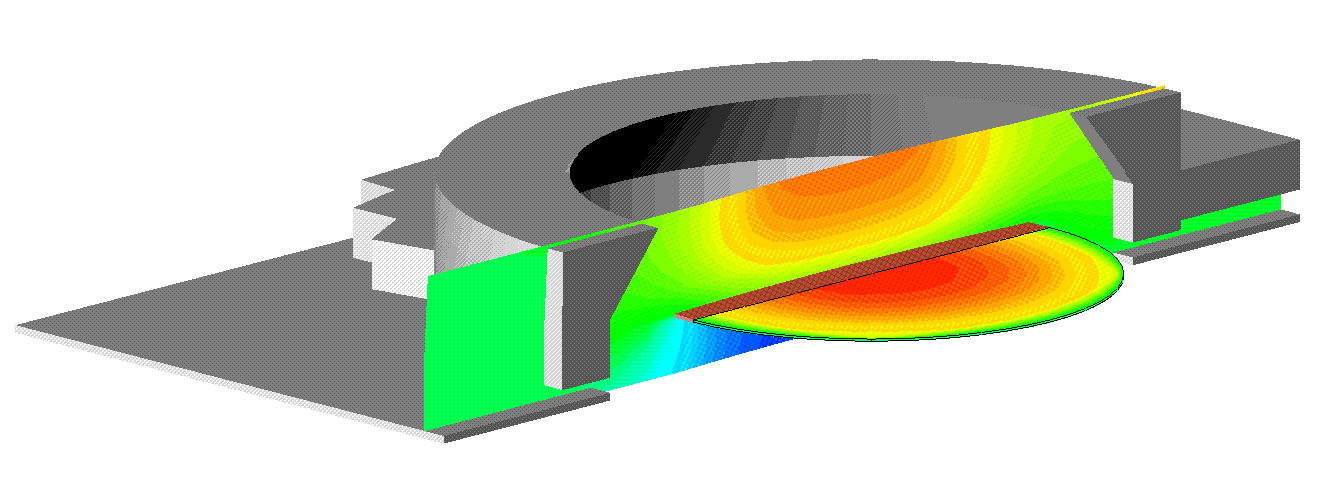
Cutaway diagram of a Jipelec-type CVD reactor used for silicon deposition from silane. The contours show silane concentration near the symmetry plane, and silicon deposition rate on the wafer.
Simulation is used to improve the design of CVD equipment, to reduce the need for prototyping and to answer the "what if" question of engineers. Using the PHOENICS-CVD software system, engineers can:-
|
|
Cutaway diagram of a Jipelec-type CVD reactor used for silicon deposition from silane. The contours show silane concentration near the symmetry plane, and silicon deposition rate on the wafer. |
PHOENICS CVD is an integrated software system designed to simulate the behaviour of a wide range of CVD reactors; this involves the modelling of fluid flow and heat transfer in a multi-component gas, including both gas phase (homogeneous) and surface (heterogeneous) chemical reactions and incorporating plasma effects.
Implementation is by means of a graphical, menu-driven, object-orientated interface, providing an easy route to problem set-up and modification.
PHOENICS CVD offers:
The code also has a user-interface, rendering it easy to use without the need for extensive CFD experience. For experienced PHOENICS users, PHOENICS Input Language (PIL) in a Q1 file can also be used.
"The following application examples can be viewed:
For more detail on the modelling, refer to the appendix.
3.1 Diffusion
Multi-component diffusion can be modelled in several ways. In increasing order of accuracy (and computational expense) these are Fick, Wilke and Stefan-Maxwell models; in each case the binary diffusion coefficients can be based on either the actual gas temperature or a specified reference temperature.
Thermal (Soret) diffusion is included using either the Clark Jones or exact formulation, incorporating the rigid spheres approximation or the use of Lennard-Jones parameters. Again, the increasing accuracy of the more sophisticated models is achieved at the expense of computation time.
Necessary parameters are taken from a transport data file, conforming to a standard format.
For more detail on the modelling, refer to the appendix.
3.2 Chemistry
For gas-phase chemistry the following options are provided for the reaction rate calculation:
extended Arrhenius dependence
Lindemann form
Troe form (9 parameters)
Troe form (10 parameters);
in addition, provision has been made for user coding.
For surface chemistry the choice is between the Langmuir-Hinshelwood formulation and a reactive sticking coefficient expression. The complexity of surface chemistry is such that many models do not fit easily into standard formats; in this case the use of user-defined reaction rates is again permitted and the Kleijn and Roenigk & Jensen models (for silicon and tungsten deposition respectively), among others, have been included in the code to exemplify this option. Complex surface chemistry, involving adsorbed species, is available using user coding; examples are provided as guidance.
Specification of the chemistry is by means of a chemistry data file in which each required reaction is included, with the model type and all necessary parameters.
For more detail on the modelling, refer to the appendix.
The properties of the gas mixture (density, kinematic viscosity, specific heat and thermal conductivity) depend on the local composition, in terms of mass fractions of the different species, and the local conditions, primarily temperature and pressure. For economy, two simpler alternatives are also provided; in these the properties are based on the carrier gas, using either the actual temperature or a reference value.
Parameters required for the calculation of the thermal properties of individual species are taken from a thermodynamic data file, conforming to a standard format.
For more detail on the modelling, refer to the appendix.
3.4 Radiation
A surface-to-surface radiation model based on viewfactors is included. The radiation contributions are used in the conventional conjugate heat transfer solution of the energy equation. The model has the ability to incorporate semi-transparent solid materials although the gas itself is assumed to be transparent. Optical surface properties are derived from information in an optical properties data file and can be dependent on b oth temperature and wavelength; the use of spectrally varying properties can be of great importance in CVD applications.
For more detail on the modelling, refer to the appendix.
Plasma modelling is achieved by means of the effective drift-diffusion model. This involves making assumptions that are generally appropriate in CVD applications; it is then possible to simulate the plasma by solving equations for the electron density, the electron temperature and the real and imaginary parts of a complex potential. In this implementation the parameters affecting the plasma are specified in advance; the plasma therefore affects the gas flow (through the chemistry, which will depend o n the state of the plasma) but there is no reciprocal interaction.
For more detail on the modelling, refer to the appendix.
4.0 IMPLEMENTATION IN PHOENICS-CVD
Standard features of PHOENICS are also available within the PHOENICS-CVD code. Here, only the items specific to PHOENICS-CVD will be described; general PHOENICS information can be found by using POLIS, the PHOENICS On-Line Information System.
The primary means of problem specification is the 'q1' input file; it is this that is interpreted by the main PHOENICS processing module (EARTH). The 'q1' file is written in a special form using PIL (PHOENICS Input Language); this can be produced directly by the user or created automatically at the end of a menu session. Although it is possible to use the menu alone without having any understanding of the 'q1' file it is strongly recommended that users develop at least a working knowledge of 'q1' file st ructure. In this way it is possible to verify that problem details have been correctly set-up within the menu and also to modify settings without the need to re-enter the menu each time. Additionally there are some more advanced features of the code that require the user to make 'q1' settings outside the menu framework.
In addition to the 'q1' input file use is made of data files specific to the individual code features.
This section will cover in turn: problem set-up using the menu, 'q1' file settings for CVD problems and data specification in the data files.
4.1.1 Preliminary activities
Before starting to use the menu it is advisable to make sure that all the information that will be needed is available. The geometrical information is particularly important and thought should be given at this stage to the way in which objects in the solution domain will be defined. Additionally, the various data files should be checked to ensure that they contain the appropriate data. These files are described in detail in Sections 4.3-4.6; note that they should be in the current working directory - if they are not, the command 'setupcvd' will do what is necessary. The built-in material property file (phoenics/d_earth/props) should contain the required solids and it is worthwhile making a note of the identification numbers at this stage for later use.
The menu session starts from a 'q1' input file if one exists in the current directory; otherwise no data will be loaded. Typing 'runsat' will start the pre-processor (SATELLITE); enter <M><CR> to select the menu. If the CVD menu is not the current choice click 'Menu' with the mouse, followed by 'Choose Menu' and the selection of CVD. Clicking 'Run Menu' will then start the CVD menu session.
4.1.2 General menu points
The menu is made up of two linked parts; the first is specific to CVD applications and the second is based on the general PHOENICS menu system. This reflects the fact that many of the settings required for a CVD simulation are also required for other types of modelling. The most efficient procedure is to define the gas species immediately (because they will be needed in the general menu for initialization and the setting of boundary conditions); the volumetric inlet option and plasma solution should also be activated if required. The remaining CVD settings are best left until the general menu has been visited (because some of them require the geometry to have been defined).
The menu leads the user through a hierarchy of panels which provide and prompt for information. Movement between panels is achieved by entering the character(s) highlighted at the left of the required option or by clicking the left-hand mouse button on that line. In some cases further information is needed: a highlighted box will then appear - enter the appropriate data followed by <CR>.
A second style of display is used to select gas species and reactions. Movement here is by up/down arrow keys and page up/down; selection is by entering <space bar> and return to the parent menu panel by <CR>.
In the general menu geometry section the mouse can be used extensively to select; for simplicity this will not always be explicitly stated.
The simplest way to understand menu operation is to work through one or more examples; in this case we shall use an ASM single wafer reactor being used for silicon deposition (a diagram of the geometry is provided as Figure1). First make sure that no 'q1' file exists in the working directory.
 |     INLET FLOW      |**********************|
C|    PLUG PROFILE     |**********************|
E|||||||||||||||||||||||**********************|
N|VVVVVVVVVVVVVVVVVVVVV|***** BLOCKAGE *******|W
T|                     |**********************|A
R|          |          |**********************|L
E|          V          |   ___________________|L
 |                     |**|                   |
L|                     |**|                   |
I|          |          |**|                   |
N|          V          |**|                   |
E|                     |__|                   |
 |                                            |
 |          |                                 |W
C|          V                                 |A
E|                  -->         -->      |    |L
N|                                       V    |L
T|                                            |
R|                                            |
E|___________________________                 |
 |****** SUSCEPTOR **********|           |    |
L|***************************|_______    V    |
I|***********************************|        |
N|***********************************|        |W
E|***********************************|        |A
 |***********************************|   |    |L
 |************ BLOCKAGE *************|   V    |L
 |***********************************|        |
 |***********************************|        |
 |***********************************|        |
 |***********************************|PRESSURE|
 |***********************************| OUTLET |
Figure 1. Reactor geometry
4.1.3 Menu operation
(a) Gas species selection
Having started the menu enter <G> to define the gas composition. No species are currently selected so enter <D> to choose from the
species data file(SPECIDAT). Move around in the display (see above for instruction) and select the following species (using <space bar>):
N2, H2, SIH4, SIH2, SI2H6, SI2H4, SI3H8.
As each is selected an '*' will appear beside its identification number. Make a note of these numbers: they will be used throughout to identify the species (with a preceding 'S' in the general part of the menu). Enter <CR> to return to the menu panel. (At this point you may enter <V> to check your selection.)
One species must be selected as the carrier gas. The mass fraction of this species will be deduced from the others rather than being solved directly; it is also used in some simplifying assumptions if these are selected later. The carrier should be the dominant species (in mass or molar fraction terms). Enter <S> and specify the carrier gas as (N2) - using <N> followed by <N2> <CR>, or <I> followed by <116> <CR>. The message at the top of the panel wil l change. Now return to the main CVD panel by entering <P> twice.
At this stage we shall also set the reference pressure to 133 Pa; enter <F>, followed by <133> <CR>. The main general menu should now be activated by entering <M>.
(b) Title
Enter <T> and follow instructions to provide a title of your choosing for the simulation.
(c) Geometry
Enter <G> to enter the geometry section.
First set up the number of cells in the computational grid by entering <S> (dimenSion) followed by <Y> 18 <CR>, <Z> 26 <CR> and then <O> (Ok); alternatively you may use the mouse. The display will reflect your settings. Note that only one cell is required in the X-direction because the problem is axisymmetric.
Next specify the physical dimensions. Enter <N> (domaiN) twice to enter the dimensions as numbers rather than using the mouse. Set the different values (selected using <X> for XSIZE, <Y> for YSIZE and <Z> for ZSIZE, or the mouse) to 0.01 (radians), 0.21 (m) and 0.34 (m) and enter <O> when they are correct.
You can modify the image using the options along the bottom of the screen; for instance, <V> (for View) can be used here, followed by rotation using the mouse; <D> (for D-xyz) and <L> (for Normal) are also helpful for clarifying the image.
Note that the grid is still Cartesian; the change to polar will come at the end of the geometry set-up.
The next task is to set up objects to which initial or boundary conditions will be attached later; in the ASM geometry we need to identify solid regions (FIN & WAFER), blank regions (BL1 & BL2), inlet, outlet, wall and wafer as shown in the diagram.
Each object is defined by specification of its size, followed by the co-ordinate values of its 'low' corner.
Enter <W> twice (to specify co-ordinates numerically rather than resizing in the geometry window). Change the object name from the default, B1, to BL1 (click the left-hand mouse button in the name box (or enter <N>), enter BL1 followed by <CR>). Because the problem is axisymmetric no changes are needed to the DX and X1 settings for any objects: all objects cover the whole x-range. The blank region BL1 extends 0.155m in the radial direction (DY) and 0.1m axially (DZ); it starts on the ax is (Y1=0) at a z-value of 0.24m (z is positive downwards). Change DY by clicking on the appropriate box followed by 0.155 <CR>, DZ similarly to 0.1 and Z1 to 0.24 <CR> (Y1 is already 0.0). When the entries are correct enter click 'Ok' (or enter <O>). The display will change to show the object BL1.
In the same way set up the following objects (x-values omitted):
|
NAME |
Y1 |
Z1 |
DY |
DZ |
|
BL2 |
0.1 |
0.0 |
0.11 |
0.1 |
|
FIN |
0.1 |
0.1 |
0.005 |
0.04 |
|
WAFER |
0.0 |
0.235 |
0.12 |
0.005 |
|
WAFET |
0.0 |
0.235 |
0.12 |
0.005 |
|
INLET |
0.0 |
0.0 |
0.1 |
0.0 |
|
OUT |
0.155 |
0.34 |
0.055 |
0.0 |
|
WALL |
0.21 |
0.1 |
0.0 |
0.24 |
The reason for the WAFET object will become apparent later.
The geometry has now been completely specified. REMEMBER! Enter <G> to change to a polar grid, followed by <K> <E> to return to the general menu.
(d) Variables
Enter <V>, followed by <L>. This confirms that the correct velocity components, pressure, temperature and species are being solved; press <CR>. <I> shows the stored variables, including the carrier species, the deposition rate variable, DEPO and PRPS (to define material properties); press <CR>. If additional variables were required <V> would provide the route for setting them.
Enter <P> to return to the general menu.
(e) Initialisation
Property settings are not necessary in this problem so we can move to initialisation by entering <I>.
Solution is made more efficient if realistic initial values can be specified for the solved variables. This is achieved by selecting the user-defined option (<U>).
Using <V> and <U> for each variable set TEM1 (temperature) to 290 and S140 (SiH4 mass fraction) to 0.113. Then enter <M> to return to the main general menu.
(f) Boundary conditions
We now need to specify the boundary conditions for the solved variables, and also define the nature of the blocked regions (BL1, BL2, FIN and WAFER).
We start with the blocked regions: BL1 and BL2 are actually to be removed from the solution domain while FIN and WAFER must be given the properties of steel.
Enter <B> and then choose <D> to define boundary conditions; <B> then enables blocked regions to be specified.
Enter <F> then <S>. This brings up a list of the available objects. Using the mouse, click on BL1 (or use the Up/Down arrows followed by <CR>). Note that the monitor view changes. As the region is blank we could select material 14 (non-participating region) (<S> 14 <CR>). This is the default, however, and can be left unchanged. Similarly, wall friction is active by default (the setting we desire), but we could deactivate it using <F>. Again though, leave this as the de fault. Return to the previous panel (<P>) and follow the same procedure for BL2.
The other blocked regions are steel (for simplicity). Enter <F> <S>, and click on FIN. The material number for steel is 12 here. Use <S> 12 <CR> to select and leave friction at its default, namely active. Return to the previous panel (<P>) and repeat the process for WAFER.
Enter <P> to set other boundary conditions, in this case the inlet and outlet, friction on the outer wall and a fixed wafer temperature of 900K.
Enter <I> for the inlet and select INLET from the list (using <F> <S>) to attach it to the object of the same name. The next panel prompts for the mass flow and incoming values of velocity components and other variables. Set the mass flow to 2.114e-3 (<M> followed by the value <CR>), W1 to 1.345 and S140 to 0.113 (<N> S140 <CR>, then <C> 0.113 <CR>). Note, TEM1 is already set correctly. Then enter <S> to set the condition before returning to the previous panel (<P>).
Select Opening (<O>) and attach it as above to the object called OUT. The specified pressure is relative to the reference pressure set before and should be left set to the default of 0 Pa. As there will only be outflow at this location it is not necessary to set values for other variables (although it is good practice to do so). Return to the boundary features panel (<P> twice).
Select boundary wall (<W>). Attach the boundary condition to object WALL (using <F> <S> and the mouse). The wall velocity is correctly set to zero and the coefficient to GRND2: this is usually used for turbulent flow but it will correctly default to laminar so there is no need to make a change. Although we shall be specifying a fixed temperature on the wall the corresponding thermal boundary condition will be set up automatically later; at this stage we must leave the adiabatic conditio n (which is a null setting). Return to the boundary condition panel (2x <P>).
The remaining condition is to fix the wafer temperature to 900K; this is achieved by means of the user-defined option (because we are specifying the temperature rather than a heat flux). Enter <U> and attach the boundary condition to object WAFET (this is why it was defined). Select Type CELL by using <T>, and then select <D> to define the conditions and select variable TEM1 (<N> TEM1 <CR>). Enter a value of 900 (<V> 900 <CR>) and change the coefficient to fix th e values (<C> FIXVAL <CR>). Note that FIXVAL, like GRND2 above, is a PHOENICS-recognised name; also note that the value must be set before the coefficient.
Return to the main general menu panel (<M>) as all boundary conditions have now been set.
(g) Solution controls
The remaining settings relate to solution procedures and output controls. The meaning of some of the terminology is explained further in the PHOENICS on-line documentation.
Enter <S> and set the number of sweeps to, say, 100 (<S> 100 <CR>). The relaxation settings can then be made by entering <R>. For this problem we will use a value of 10 (<U> 10 <CR>). It is usually beneficial to apply linear relaxation to the temperature TEM1; to achieve this enter <R>. Then enter <N> TEM1 <CR>; <T> then toggles between the two available relaxation types - select LINEAR and a value of 0.3 (<V> 0.3 <CR>). Return to th e main general menu panel (<M>).
(Note: plasma variables, if active, will usually require a very small setting of FALSEDT. This is because they are unaffected by the gas flow that normally determined the appropriate relaxation level.)
(h) Monitoring controls
The print-out controls can be left at their default settings but it is sensible to match the monitoring location to the problem. While the code is running the values of selected variables in the monitoring cell will be displayed. It is worth selecting a 'sensible' cell which will provide useful information on the progress of the solution. Enter <M> and set the location (<Y> 5 <CR>, <Z> 15 <CR>). Note that the selection is visible on the monitor view.
Set up graphical monitoring by entering <M> (which toggles between ASCII, i.e., text, and GRAPHICS).
We also select <H> followed by <T>: this will provide tables in the result file showing the spot values and residuals of the solved variables during the solution.
Enter <M> to return to the main general menu.
The work in the general menu is now complete. Enter <E> to return to the CVD menu.
(i) General CVD features
We are now in a position to select CVD settings. The geometry has been used already to create surfaces around each object. These will be used in the definition of boundary conditions for the radiation (thermal zones), surface chemistry and, if activated, plasma modelling.
Enter <S> to see what has been done. Enter <A> to view all the surfaces. By using the zoom command it is possible to separate labels that are otherwise masking each other. Return to the previous panel (<P>)
It will be necessary later to modify the boundary settings on those surfaces that are on the edge of the domain or the edge of a blank region (BL1 and BL2): these are surfaces 1, 4, 5, 7, 10, 18 and 19 which should be noted. 'Internal' surfaces such as 11-14 will be dealt with internally without any intervention.
The opportunity to view graphically the geometry and boundary conditions is provided frequently; the display is controlled by selecting 'Set View' in such panels.
(j) Radiation
Select radiation (<R>) followed by <A> to activate it. The code has now set up default thermal zones on appropriate surfaces. Enter <V> followed by <A> to see what has been done. The white lines are thermal zones, the red ones are (parts of) surfaces where no thermal zone has been set. The key point is that the whole of the gas region is surrounded by zones (apart from the symmetry axis): no radiation energy will be lost from the system.
Return to the menu panel and enter <L> to list the zones. The location of each is given, together with its associated surface. Return to the top radiation panel (<P>). We now need to set up boundary conditions for each zone, working from the defaults that have been provided. We will do this on a surface-by-surface basis (although zone-by-zone is possible).
Select <M>. The current surface is 1, for which we must modify boundary conditions: enter <B>. The default setting for an 'outside' zone is adiabatic. We change this to constant temperature by pressing <C> and then <V> 290 <CR> to set the fixed value. The optical property index defaults to 198, which represents black body. In this case the outer walls are steel, which has an index of 111: enter <O> 111 <CR>. The optical property temperature determines the tempera ture at which the properties will be calculated: it agrees with the value we just set. Select <U> to change the boundary settings on all zones on the surface followed by <P>. Then follow the same procedure for surfaces 4, 5, 7 and 10 which were noted earlier.
For surfaces 18 and 19, corresponding to the inlet and outlet respectively, the default is a fixed temperature, representing external radiating surfaces; the optical index depends on the nature of the external region - it may be appropriate to specify 198, for black body conditions, or 111 for steel, depending on the external conditions. For this case leave the settings unchanged and return to the previous panel (<P>).
Internal surfaces need less attention. Enter <S> 11 <CR> followed by <B> to see an example. The coefficient is set to GRND1 (PHOENICS notation); this is usually suitable but <C> will toggle with GRND2 which is less stable but can sometimes be quicker. The optical property index is correct (because it is based on the solid material already defined). The temperature (which is only used for optical property calculation) will be left at the default to save time. (Strictly we should se t the optical property temperature to 900K for the surfaces on the edge of the susceptor, to match the fixed temperature there.) Enter <P> twice to return to the previous panel.
The other settings for radiation are not needed in this case; they relate to symmetry options and various advanced settings. Enter <P> to return to the top CVD panel.
(k) Diffusion settings
Enter <D> to select the models for multi-component diffusion and gas properties. <T> offers the settings for thermal diffusion: four models are available, with varying degrees of complexity. For economy an update frequency is included: this is the frequency with which the thermal diffusion source terms will be updated. Leave thermal diffusion inactive and return to the previous panel (<P>).
Enter <M> to select the diffusion option. The default is the Wilke approximation which is satisfactory. Enter <B> to see the binary diffusion options: choose the actual gas temperature by entering <A> before returning to the diffusion and gas properties panel (<P> twice).
Select <G> to set the gas properties: the default uses the gas composition at the prevailing temperature but two simpler options are also provided. Return to the main CVD panel (<P> twice).
(l) Chemistry
Select <C> to define the chemistry. The first task is to choose reactions: enter <D> to see what is available. The list comes from the CHEMIDAT file: G refers to gas phase reactions and S to surface reactions. The Kleijn model for silicon deposition is represented by reactions 6, 7, 9, 10-16; select these (using <space bar>) and return to the menu using <CR>.
As surface reactions are included we must define the surfaces on which they occur: enter <S> and then <C> to create a surface patch. The surface patch occurs on the wafer surface: this is numbered 16 (you can use the View option to check) so enter <S> 16 <CR>. The range is correct: the reaction is across the whole surface. The batch factor should be left as 1: a higher value is used if many physical surfaces are represented by a smaller number of computational ones. Enter <C> ; to create the surface chemistry patch before returning to the previous panel (<P>). View all the patches (<A>) to confirm what has been achieved: the patch is in the correct place and has been named to show the surface to which it is attached. Return to the menu and then to the previous panel (<P>).
We will now set a relaxation patch based on the chemistry (in addition to the flow based relaxation already activated): enter <R> followed by <A> to activate the patch. The default factor of 0.5 is satisfactory so enter <P> twice to return to the main CVD panel.
All settings have now been made so enter <E> to exit. This takes you back to the 'Top Level' menu. Using the mouse, click 'End' and then 'Confirm'. This will end the SATELLITE session and create a 'q1' file for future use.
This example has demonstrated the general use of the menu. There are many more options that have not been used and you might like to investigate them further. It is advisable to save the 'q1' file just created before doing so: use the standard copy utility on your machine to do this. Typing 'runsat' will re-load the data in the 'q1' file, ready for modifications to be made.
Following the menu operation you are in a position to carry out the simulation by running EARTH - this is the heart of PHOENICS-CVD: type 'runear'. The case set up above will typically take a few minutes to run, depending on the machine being used. To view the subsequent results access PHOTON, the post-processor (by typing 'runpho') -this is part of the standard PHOENICS installation.
In this section the 'q1' settings required to activate the different model options are described; a working knowledge of the PHOENICS Input Language is assumed. The CVD options are activated by setting NAMGRD=CVD; this line should therefore always be included.
4.2.1 Variables
The primary variables are the mass fractions of the gas species. These should be identified as scalar variables between C1 and C30 inclusive (corresponding to integers 16 to 45) and it is essential that no other variables should occupy any of these allocations. One (and only one) of the mass fractions should be stored rather than solved; its value will then be deduced by the requirement that the mass fractions must sum to unity. It is recommended that the dominant species (in terms of mass or molar f raction) should be the one to be stored; the stored species will also be the one used internally if material properties are based on the carrier gas rather than the local mixture. All solved species should be solved whole-field by use of the SOLUTN setting.
Certain other variables must also be stored:
Additional variable names are also recognised if storage is activated for them in the 'q1' file; the appropriate values will be inserted automatically within the code and can then be printed in the 'result' file or viewed using the PHOTON post-processor. These are FR01-FRnn, MD01-MDnn, SP01-SPnn, SN01-SNnn, SPHT and KOND; they refer to molar fractions for each species, multi-component diffusion coefficients for each species, positive and negative gas-phase chemistry sources for each species, mixture spec ific heat and mixture thermal conductivity respectively. Here 'nn' is the total number of gas species. (Note that the molar fractions, diffusion coefficients and sources will be in an internal order - this will be different from the order used in the 'q1' file only if the first species named in the 'q1' file, C1, is not the one that is stored rather than solved.) Care must be taken when using the optional storage to ensure that only species mass fractions occupy the positions 16 to 45 in the variable list. Note that SPHT will contain an effective specific heat, defined as (h-h0)/T, where h is enthalpy, T temperature and subscript 0 refers to 250K.
The different gas species involved in the simulation must be identified using the NAME command. The available species are listed in the data file SPECIDAT which can be modified to suit the user's requirements (subject to a limit of 300 species and the proviso that the corresponding species must all appear in the transport and thermodynamics data files (TRANSDAT and THERMDAT). The name of a species is made up of 'S' followed by the identifying number in SPECIDAT (so S80 is hydrogen if the default SPECIDAT is used).
4.2.2 Diffusion settings
Settings are required in the 'q1' file to determine which of the various models will be used for multi-component and thermal diffusion. These make extensive use of the SPEDAT command, the use of which can be understood from the 'q1' files provided and the examples below.
In the first case the choice is between Fick, Wilke and Stefan-Maxwell. Multi-component diffusion is activated by the PRNDTL command for the mass fraction variables; the appropriate setting is -GRND8. Model selection is specified by the variable MCDOPT using the SPEDAT command - values of 1, 2 and 3 respectively should be used. For Stefan-Maxwell diffusion it is often necessary to implement linear relaxation, using SPEDAT to define the relaxation factor, SMRLX. The binary diffusion coefficient can be cal culated using actual temperature or a reference value, selected by values of 4 and 2 respectively for BINOPT (again specified using SPEDAT); if a reference temperature is required it must be allocated to TMP1A.
Thermal diffusion options also make use of SPEDAT to define THMDIF, THMOPT and THMFRQ. The first of these should be set to T to activate thermal diffusion; the second determines the model to be used:
1 - Clark Jones form using rigid spheres approximation
2 - Clark Jones form using Lennard-Jones parameters
3 - exact form using rigid spheres approximation
4 - exact form using Lennard-Jones parameters.
These are in increasing order of computation time; as a computational economy it is possible to update the thermal diffusion source terms less frequently than every sweep by setting THMFRQ to a value greater than 1.
Both Stefan-Maxwell and thermal diffusion require the settings USOURC=T and UDIFNE=T; these settings should anyway be made to include the energy transport caused by diffusion fluxes, as should DIFCUT=0.0. (Note that it is possible, though not recommended, to leave out these settings if neither Stefan-Maxwell nor thermal diffusion is active; in that case the energy flux associated with diffusion fluxes will also be omitted.)
As an example the settings
SPEDAT(SET,CVD,MCDOPT,I,3)
SPEDAT(SET,CVD,SMRLX,R,0.5)
SPEDAT(SET,CVD,BINOPT,I,4)
SPEDAT(SET,CVD,THMDIF,L,T)
SPEDAT(SET,CVD,THMOPT,I,3)
SPEDAT(SET,CVD,THMFRQ,I,3)
(in addition to the appropriate PRNDTL, USOURC, UDIFNE and DIFCUT settings) activate thermal diffusion based on the exact form using the rigid spheres approximation with source updates every three sweeps, binary diffusion coefficient calculation based on actual temperature and Stefan-Maxwell diffusion with a relaxation factor of 0.5.
4.2.3 Material property settings
Material property settings are implemented by storing the variable PRPS and the specification of the selected property values in the 'q1' file. Density (RHO1), specific heat (CP1), laminar viscosity (ENUL), and thermal diffusion coefficient (PRNDTL(TEM1)) settings will then be taken from the property information table. The commands FIINIT(PRPS)=70 and CSG10='q1' enable the user to specify this property information in the 'q1' file (provided that property setting 70 has not been added to the 'props' f ile in the PHOENICS d_earth directory). The following indented lines should then be included in the 'q1' file:
	MATFLG=T; IMAT=1
	70   GRND8   GRND8   GRND8   GRND8   1.000
	0  0
	0  0
	0  0
	0  0
The method to be used for the calculation of mixture properties is given by a SPEDAT command for the variable MCPROP: 1 refers to the carrier gas at a reference temperature, 2 to the carrier gas at actual temperature and 3 to the actual gas composition at the actual temperature. Again TMP1A determines the reference temperature to be used, if required. One line of zeros should be included for each GRNDn entry in the property definition line. Additional materials can also be specified he re if IMAT is suitably increased.
4.2.4 Chemistry settings
Gas-phase chemistry is activated by means of a PATCH which will normally cover the whole solution domain (solid regions will be excluded automatically by the code). The patch name should start with 'CHEM' and the type should be VOLUME. To allow for source linearisation both coefficient and value must be set to GRND1; COVAL statements are required for all species and the temperature TEM1.
Surface chemistry is activated by means of a PATCH having a name that starts with 'SURF' (note that there must be at least one additional character); the patch type should be the appropriate area (e.g. SOUTH) and the patch should only extend over the gas cells adjacent to the solid surface. COVAL statements should be provided for all species (including those that are not involved in the surface reactions), TEM1 and P1; this ensures that the Stefan velocity (flux to the surface) is correctly included. The coefficient should be set to FIXFLU and the value to GRND1 in all cases except P1; there the coefficient should be set to the 'batch factor'. For a conventional surface chemistry patch this will be 1.0. A higher number can be used if the computational surface represents several physical surfaces; by this means a batch reactor can be approximately simulated without modelling each wafer individually (useful if a parametric study is being undertaken for which run times would otherwise be unacceptable). If the coefficient is given an inappropriate setting (eg FIXFLU) a batch factor of 1.0 will be assumed.
Automatic under-relaxation based on the chemistry sources can be useful in avoiding convergence problems caused by strong chemical reactions; this is introduced by means of a PATCH called RELT having PHASEM type. COVAL statements should be provided for all species involved in the chemistry, with a coefficient of GRND1 and a value of SAME. A linear relaxation factor, CHMRLX, can then be specified using SPEDAT: values are between 0 and 1, with low values signifying tight relaxation. Note that conventional relaxation may also be needed, particularly for any species that do not participate in the chemistry. Linear relaxation is recommended for TEM1 and a small value (say 0.3) may be necessary to ensure stability.
The reactions to be included in the simulation are specified using their identification numbers in the CHEMIDAT data file; additionally, the total number of gas-phase and surface reactions, NGREAC and NSREAC respectively, must be given. In all cases SPEDAT is used. The individual reaction numbers are specified using GREAC and SREAC in the two cases. As an example,
SPEDAT(SET,CVD,NGREAC,I,2)
SPEDAT(SET,CVD,GREAC(1),I,6)
SPEDAT(SET,CVD,GREAC(2),I,7)
SPEDAT(SET,CVD,NSREAC,I,1)
SPEDAT(SET,CVD,SREAC(1),I,12)
declares two gas-phase reactions (6 and 7) and one surface reaction (12).
An output file 'data' is created by the code, containing information about the species present and the reactions that have been selected. This should always be checked for consistency; any mass imbalance in a selected reaction will in any case cause the code to issue a warning message.
4.2.5 Radiation settings
Radiation is implemented by setting S2SR=T in the 'q1' file; additionally it is necessary to provide storage for variable EMIS which is used internally to define surface optical properties.
The model is based on a surface-to-surface viewfactor approach, i.e. it is assumed that the gas is transparent. Thermal zones must be defined to cover all solid surfaces and viewfactors are then calculated between all pairs of thermal zones (taking account of any semi-transparent solid regions). From these a radiation exchange matrix is calculated that fully defines the energy transfer between surfaces in terms of the surface temperatures, which are calculated unless they are defined as fixed. Each therm al zone requires PATCH and COVAL commands to define the location, type and boundary conditions for the zone. The patch names must start with @RI; the patch type must always be an area, e.g. SOUTH. For zones on the surfaces of solids for which conjugate heat transfer is being employed (referred to below as internal surfaces) the patch should be on the solid side of the surface; otherwise (for example, at the domain edge) the patch should be on the gas side of the surface.
For each thermal zone there must be a COVAL command for TEM1; the coefficient and value determine the type of thermal boundary condition:
|
Coefficient |
Value |
Boundary condition |
|
GRND1/2 |
GRND1 |
Zero applied heat flux (internal surface) |
|
GRND1/2 |
VAL |
Fixed heat flux of VAL (external surface) |
|
0.0 |
VAL |
Fixed temperature of VAL (external surface) |
|
GRND3 |
k/d |
Thin plate |
|
GRND4 |
k/d |
Gap |
Zero applied heat flux is the only permitted setting for an internal surface. External surfaces (i.e. surfaces of non-participating solids) normally have a specified surface temperature or heat flux; the 'internal' setting is also possible if a matching PATCH is specified linking the zone to external conditions (@ER or @EL patches: see POLIS for further details). GRND1/2 indicates that either GRND1 or GRND2 can be used: GRND1 is usually preferred although in some circumstances the less stable GRND2 can be more efficient. The thin plate and gap options both require the user to specify the value of k/d: the conductivity of the solid plate or gap divided by the thickness. These facilities are useful in enabling features which are too small to be modelled using the computational grid to be incorporated, albeit approximately, in a simulation. In each case the cell faces at the plate or gap should be blocked by setting the appropriate face porosity (eg EPOR) to zero. Note that thin plates and gaps cannot be set up using the menu in this release.
In addition to its radiation patch, a fixed temperature thermal zone should be accompanied by an appropriate laminar wall boundary condition for temperature in the conventional manner (see examples); the menu will do this automatically.
A COVAL command is also necessary for the variable EMIS at each thermal zone. The coefficient determines the solid material according to the numbering system in the data file
OPTICDAT. The value, if positive, specifies a reference temperature which will be used to calculate optical properties; a negative value is used to indicate the thickness of a semi-transparent coating. If a semi-transparent coating is indicated, the EMIS coe fficient will determine the optical properties in the layer; the optical properties of the background material will be determined by the PRPS value there: it is therefore necessary to ensure that consistency is maintained between PRPS values and the material labels in the optical data file. The temperatures specified for the surface property calculation can only be a guess before the run has been carried out; for the highest accuracy it would be necessary to carry out additional runs for which the thermal z one temperatures are taken from the result file for the preceding run (these values are listed at the end of the result file). Typically one or two continuation runs would be sufficient.In order that the accuracy of the viewfactor calculation can be seen by the user, two energy conservation checks are provided. The first relates to the viewfactors themselves and the second to the radiation exchange matrix; in each case the calculated value is printed out for each thermal zone (to the screen and also to the output file 'rad.dat' (see below)), together with the correct value. Errors of more than 1-2% should be regarded with suspicion: first check that the radiation patches have been corre ctly specified, then try increasing the number of test rays used (see below) and then increase the number of thermal zones until satisfactory agreement is achieved. In any case, each thermal zone should be defined so that the surface temperature does not vary significantly over it.
An output file 'rad.dat' is created by the code; in addition to information about the thermal zones that have been defined it contains the array of viewfactors between the thermal zones, the accuracy checks referred to above and the radiation exchange matrix elements. This file should be saved if further simulations using the same geometry and thermal zones are to be carried out. It can then be renamed as RADI.DAT; if a file of that name is present in the current directory when a run is started the infor mation it contains will be used and no viewfactor calculation will be carried out. This can be a significant time-saving feature but requires care. Use of the wrong RADI.DAT will usually cause an error because the number of thermal zones will be incorrect; however, if the number of thermal zones in RADI.DAT is the same as that in the case being run the simulation will continue based on incorrect information. If a second run is carried out using the same thermal zone definition but with differing surface pro perties it is possible (provided that no semi-transparent solids are present) to use the previous viewfactor calculation as the basis for the derivation of the new radiation exchange matrix; to achieve this it is necessary to modify 'rad.dat' to remove everything below the viewfactor array listing before renaming it as 'RADI.DAT'.
Several additional settings are available within the surface-to-surface radiation model; these make use of the SPEDAT command. XMIR, YMIR and ZMIR are logicals which, if set to T, indicate symmetry in the corresponding coordinate directions (only available in 3-D); AXIBFC enables a 2-D BFC case to be specified as axisymmetric. By default the spectral variation of surface optical properties from OPTICDAT is used; the constant values in the file can be chosen instead by setting NOSPCT to T. In 3-D viewfact or calculations a coarse calculation is used in the construction of the viewfactors if an internal accuracy check is satisfied; this can result in view factor symmetries being only approximately satisfied. The logical FINE3D can be used to force the fine calculation under all circumstances; this should restore the symmetries, albeit at a cost in computation time. The viewfactors are usually renormalised before the radiation exchange matrix is derived as a means of ensuring good energy conservation; again, t his may remove certain symmetries and lead to small anomalies in the results. VFNORM can be set to F to remove the renormalisation (energy conservation will then be imposed by modifications to the radiation exchange matrix instead). The accuracy of the viewfactor calculation can improved by increasing the number of test rays used in the determination of each zone-to-zone, or cell-to-cell, viewfactor; the number of rays is specified using NUMRAY. Note though that there is an internal limit of 5, and that NUM RAY has no effect in 3-D cases for which only one ray is used for each cell as a computational economy.
View factors in cyclic geometries can be calculated but only if BFC=T. If a polar grid is used it is necessary to carry out a preliminary calculation for which BFC=T is set in the 'q1' file after the geometry has been defined; the 'rad.dat' file can then be used as input for the real case (BFC=F) as already described.
4.2.6 Plasma settings
If the plasma model is activated it is necessary to solve for an additional four variables: T0, NE, PHI1 and PHI2; these are respectively the electron temperature, the electron density and the real and imaginary parts of the complex potential (note that electron density is quoted in units of 1016 electrons/m3 to avoid excessively large numbers). As for the other scalar variables, whole-field solution should be activated.
Additional variable names are also recognised if storage is activated for them in the 'q1' file: PHIT and GAMM are the amplitude and phase angle of the complex potential and GION is the ionization rate.
The diffusive nature of the equations in the effective drift-diffusion model requires the modification of the standard PHOENICS transport equations to remove the other terms; this is achieved by setting TERMS(...,N,N,Y,P,Y,N) for each plasma variable. The diffusion coefficient is set by PRNDTL(...)=-GRND7 in each case.
The source terms in the T0 and NE equations are set up using two patches which cover the whole domain (solid regions being dealt with internally); the patch names are 'COOL' and 'IONIZE'. Each patch has type VOLUME and COVAL statements are required for T0 and NE; in each case both coefficient and value should be set to GRND7. Other parameters in the plasma equations are specified using arrays T0PAR, NEPAR and PHIPAR in SPEDAT statements; the meanings are as follows:
NEPAR(1):Bohm velocity (m2/s)
NEPAR(2):Ionization rate - upper bound on Arrhenius term (/s)
NEPAR(3):Ionization rate - multiplying factor in Arrhenius term (/s)
NEPAR(4):Ionization rate - activation energy in Arrhenius term (K)
NEPAR(5):Ionization rate - field independent rate (/(m3/s))
T0PAR(1):Ohmic heating coefficient ((m2K)/(V2s))
T0PAR(2):Diffusion coefficient (m2/s)
T0PAR(3):Cooling source term - time constant (/s)
T0PAR(4):Cooling source term - equilibrium temperature (K)
PHIPAR(1):Sheath parameter (m4/1016 electrons)
PHIPAR(2):Electron mobility (m2/(Vs))
PHIPAR(3):Phase angle of externally applied potential (radians)
PHIPAR(4):Magnitude of externally applied potential (V).
In addition to the terms in the plasma equations it is also necessary to specify appropriate boundary conditions. For T0 no action is required; this ensures zero energy flux across boundaries. For the potentials, patches will be required for electrodes and earthed surfaces; all these patches should have the appropriate area type and COVAL statements for PHI1 and PHI2 with a coefficient of FIXFLU and value of GRND7. Electrode patches should have a name starting with 'ELE'; the externally applied potential referred to above will be applied there. All other PHI1 and PHI2 patches of area type will be at zero potential (corresponding to earthed surfaces). NE boundary conditions should be specified at any surface through which electron flux is permitted. The patch type should again be an area, so the potential patches can be used for this purpose; the coefficient for NE should be GRND7 and the value 0.0.
Realistic initialisation for plasma variables can be very beneficial; in particular, an inappropriate value for T0 can have severe consequences because it is used in an exponential term in the electron density equation.
The plasma variables influence the chemistry and thus the flow; however, the flow only influences the plasma via the parameters in the plasma equations, which are dependent on gas composition. In the current release these parameters are taken to be constant and the plasma equations are then independent of the other variables. It is therefore possible to solve for the plasma first, in isolation, and then restart with solution for gas species and flow variables once a reasonable plasma solution has been ob tained. This can be economical because no time is spent on the flow and chemistry solution while the plasma variables (and thus the reaction rates) are still unrealistic.
The use of linear relaxation for plasma variables can cause convergence difficulties when block correction is implemented. False timestep is then recommended; the appropriate value can be small, typically O(10-6).
4.2.7 Additional features
To facilitate CVD modelling two additional features have been provided; the first relates to inlets and the second to shower plates.
Inlets are normally defined in terms of mass flow (per unit area), with incoming velocity, temperature and species mass fractions also being specified. As an alternative it is possible to give the flow in terms of sccm (standard cubic centimetres per minute) over an area that must also be given; the incoming gas composition must then be defined in terms of molar, rather than mass, fractions. To select this option the patch name must begin with 'VIN'. COVAL statements are required for P1 and all other var iables defining the incoming stream; the coefficients are FIXFLU for P1 and ONLYMS for other variables, as usual for an inlet. The value for P1 is the inflow (in sccm), the value for the velocity normal to the inlet face is the corresponding area and the values for the gas species are molar fractions. Thus
PATCH(VIN1,LOW,........)
COVAL(VIN1,P1,FIXFLU,100.0)
COVAL(VIN1,W1,ONLYMS,0.1)
COVAL(VIN1,S80,ONLYMS,0.2)
specifies an inflow of 100sccm over an inlet area of 0.1m2; the gas composition is 20% S80 (hydrogen) by volume. Note that this feature cannot be used in BFC cases.
Shower plates are common in CVD reactors and a special patch has been defined to model them. The region in question should first be defined to have the appropriate solid properties (using PRPS); an additional patch should then be defined in the same place having a name beginning with 'SHWR' and an area type that indicates the plane of the plate. COVAL statements are required for all solved scalar variables in addition to the velocity component normal to the plate. All values should be GRND7 and the coeff icients should be ONLYMS, with the exception of those for P1 and the normal velocity which have a special meaning. The coefficient for the normal velocity should be the open area fraction (porosity) of the plate and that for P1 should be a loss parameter. This is defined as dp/(dynamic viscosity x mean velocity), where dp is the pressure drop across the plate; for circular holes this will be equal to 32l/a2, where l is the thickness of the plate and a is the diameter of the holes. As an example,< /P>
PATCH(SHWR1,HIGH,........)
COVAL(SHWR1,P1,32000.0,GRND7)
COVAL(SHWR1,W1,0.5,GRND7)
COVAL(SHWR1,S80,ONLYMS,GRND7)
COVAL(SHWR1,TEM1,ONLYMS,GRND7)
CONPOR(PLAT1,-1,........)
COVAL(PLAT1,PRPS,0.0,111)
represents a steel plate with 50% open area and a loss parameter of 32000 (possibly representing a plate 1mm thick with holes of 1mm diameter). Note that a new PRPS number should really be specifically defined so that the plate would have the properties that take account of its porous nature; the two patches should cover the same range of cells.
The use of a stiff solver is possible for cases where the chemistry is much more important than the flow effects; this can be activated by setting USOLVE=T. Using this approach involves solving for all species, including the carrier; the code will automatically make this adjustment but the user should ensure that all appropriate COVAL statements are provided for the species that is nominally stored (such statements would not be needed under normal circumstances).
4.2.8 Summary of 'q1' settings
This section contains a review of the settings described in the preceding sections.
Group 7:
Variables to be solved or stored:
|
Flow variables, including: |
TEM1 |
|
Mass fractions |
C1-C30 (one stored, rest solved) |
|
Radiation variable (if used): |
EMIS |
|
Other required stored variables: |
PRPS, DEPO |
|
Optional stored variables: |
FR01-FRnn, MD01-MDnn, |
|
|
SP01-SPnn, SN01-SNnn, |
|
|
SPHT, CNDT |
|
Plasma variables (if used): |
T0, NE, PHI1, PHI2 |
Use whole-field solver (default) for all solved scalar variables
Species identification:
NAME(C*) = Snnn (nnn is the identifier in SPECIDAT)
Group 8:
USOURC = T, UDIFNE = T, DIFCUT = 0.0
TERMS(...,N,N,Y,P,Y,N) for each plasma variable
USOLVE = T if stiff solver used
Group 9:
PRNDTL(Cn) = -GRND8
RHO1 = GRND10, CP1 = GRND10, ENUL = GRND10,
PRNDTL(TEM1) = -GRND10
PRNDTL(...) = -GRND7 for each plasma variable
Property information as required, using CSG10 = 'q1'
Group 13:
Gas phase chemistry:
PATCH(CHEM*,VOLUME, ........ )
COVAL for solved species and TEM1
Surface chemistry:
PATCH(SURF*,area type, ........ )
COVAL for all solved species, P1 and TEM1
Under-relaxation based on chemistry:
PATCH(RELT,PHASEM, ........ )
COVAL for each solved species
Radiation:
PATCH(@RI***, area type, ........ )
COVAL for EMIS and TEM1
Plasma sources:
PATCH(COOL,VOLUME, ........)
COVAL for T0 and NE
PATCH(IONIZE,VOLUME, ........)
COVAL for T0 and NE
Plasma boundary conditions:
PATCH(ELE*, area type, ........)
COVAL for PHI1, PHI2 and NE
PATCH(***, area type, ........)
COVAL for PHI1, PHI2 and NE
Group 17:
Linear relaxation for TEM1
Group 19:
S2SR = T (if radiation activated)
SPEDAT(SET,CVD,parameter,type,value) for (some of) the following parameters:
Diffusion:
MCDOPT integer
SMRLX real
BINOPT integer
THMDIF logical
THMOPT integer
THMFRQ integer
Gas properties:
MCPROP integer
Chemistry:
CHMRLX real
NGREAC integer
GREAC(1:n) integer(s)
NSREAC integer
SREAC(1:n) integer(s)
ANJAC logical
Radiation:
XMIR logical
YMIR logical
ZMIR logical
AXIBFC logical
NOSPCT logical
FINE3D logical
VFNORM logical
NUMRAY integer
Plasma:
NEPAR(1:5) real
T0PAR(1:4) real
PHIPAR(1:4) real
4.3 Species data file (SPECIDAT)
The species data file is used to list the species that are available, up to a limit of 300. A sample demonstrates the format:
140 G SIH4
141 G SIH3
142 G SIH2
The identification numbers must run consecutively, starting at 1. The following letter indicates a gas species (G) or a surface adsorbed species (A); the species name which follows must be exactly the same as that used in other data files. Adsorbed species can be used if appropriate surface chemistry is selected.
4.4 Chemistry data file (CHEMIDAT)
4.4.1 Data file entry format
The chemistry data file, CHEMIDAT, contains all the information required to calculate the reaction source terms in the species mass fraction equations. The reactions are identified by a character (G for gas-phase or S for surface) and an integer (the reaction number). Each reaction is allocated a number of lines with these identifiers at the start of the first line. Comments can be included between entries using ! as the first character on such lines.
A sample from the file indicates the nature of the entries:
!-----G5-------------
G 10 3 SI2H6<=>SI2H4+H2 2.100E+10 0.000E+00 1.930E+05 5.000E-01
  3 SI2H6 -1 SI2H4 1 H2 1
  0
    0 0
!----------------------------------------------------------------------------------
! Kleijn model: surface reactions
! the parameters for the sticking coefficients of S1 and S3 were taken from
! C.R. Kleijn, "Transport Phenomena in CVD reactors", PhD thesis, TU Delft, 1991
!----------------------------------------------------------------------------------

!-----S1-------------
S 11 5 SIH4<=>SI+2H2 		0.000E+00 0.000E+00 	0.000E+00 0.000E+00
  3 SIH4                  -1 SI 	1 H2 			2
  0
-101 7 8.000E-02-7.500E+03 1.200E-06 4.990E+04 1.700E+04-1.538E+05
       6.100E-01
SI 			2.300E+03 2.809E-02 2.252E-05
The format of the first line is A1,I3,I2,1X,A32,1P4E10.3. The entries are, in order: the character identifier, the reaction number, the number of additional lines in the entry, the reaction in symbols (for information only) and the four Arrhenius parameters.
The format of the second line is 1X,I2,4(1X,A16,I3). The entries are, in order: the number of species in the reaction (maximum 8), the name and stoichiometric coefficient for each species (up to 4). If more than 4 species are involved a continuation line should be inserted with format 3X,4(1X,A16,I3). There is no need to fill either line if the number of species does not require it.
The format of the third line is 1X,2I4. This line will be used for third-body enhancement factors but is currently not used: zeros should be inserted.
The format of the fourth line is 1X,2I4,1P6E10.3. The entries are, in order: IRT (defining the reaction type - see below), the number of additional parameters (maximum 90) and the values of those parameters (up to 6). If more than 6 additional parameters are used a continuation line should be inserted with format 9X,1P6E10.3; again there is no need to fill the line.
For surface reactions there is another line; its format is 1X,A16,1P3E10.3. The entries are the name of the deposited species, followed by its density and molecular mass; the final entry is the surface concentration of vacant sites (mol/m2) which is only required if adsorbed species are being used. Users intending to use adsorbed species in their surface chemistry modelling should consult CHAM for advice before proceeding.
4.4.2 Reaction rate calculations
The formulation to be used for a reaction is specified in the data file by means of the integer IRT (on line 4). A negative value indicates the use of user-coding; this should be inserted in functions GAF and GAR, for forward and reverse gas-phase chemistry, or GFLUX, for surface chemistry (both these routines are in the 'cvdchm' file). Non-negative values select built-in options as described in Appendix 1; only the specification of the parameters is described here. All the options are selected by th e value of IRT, modulo 100; that leaves the 'hundreds column' free to be used for passing additional information about the reaction
(a) Gas-phase reactions
The built-in reaction are:
0 - extended Arrhenius (4 parameters)
1 - Lindemann form (6 parameters)
2 - Troe form (9 parameters)
3 - Troe form (10 parameters).
The Arrhenius parameters appear on line 1 of the data file entry in the order Ak, bk, Ek, ck, with ck only used in the extended Arrhenius option; for all other choices the first three parameters are Ak,inf, bk,inf, Ek,inf. The line of additional parameters contains as many as necessary of, in order,
Ak,0, bk,0, Ek,0, ak, T1,k, T3,k, T2,k;
the Lindemann form requires only the first three, the 9 parameter Troe form requires the first six, and the 10 parameter Troe form requires all the parameters.
The 'hundreds column' of IRT is used to determine whether gas or plasma temperature should be used in calculating reaction rates, and whether the reaction is reversible; a value of 5 indicates plasma temperature, 0 represents a reversible reaction and 1 an irreversible one.
As examples, IRT=3 activates the 9 parameter Troe form using gas temperature, IRT=501 the Lindemann form using plasma temperature and IRT=-2 user-coding.
(b) Surface reactions
The built-in options are:
0 - sticking coefficient formulation
1 - Langmuir-Hinshelwood formulation.
The Arrhenius parameters in the sticking coefficient appear on line 1 of the data file entry in the order Ak, bk, Ek (the fourth entry is not used, but should be present); if Ak=0, a sticking coefficient of unity is used.
User-coding has been included for the Kleijn model for SiH4 and Si2H6, the Roenigk and Jensen model for SiH4 and the Kleijn et al model for tungsten production from WF6 and H2; these correspond to 'units column' values of 1 to 4 respectively. A plasma model has been added for demonstration purposes only; it uses a value of 5.
The 'hundreds column' of IRT is used to determine the rate-determining mechanism for the surface deposition:
1 - kinetics limited
2 - diffusion limited
3 - diffusion/kinetics limited
4 - no deposition.
As examples, IRT=100 activates the sticking coefficient form with the reaction limited by kinetics and IRT=-301 the Kleijn model for SiH4 deposition, taking account of both kinetics and species diffusion to the surface in determining the reaction rate.
The use of diffusion limitation should be used with care as it can result in significant underestimation of reaction rates. It can be necessary when the surface reaction formulation specifies a sub-linear dependence on reactants which would become unrealistic at low concentration levels.
4.5 Optical properties data file (OPTICDAT)
The optical data file, OPTICDAT, defines the surface properties for use in the surface-to-surface radiation model. The bulk of the information it contains for each material relates to the temperature dependence of the refractive index and absorption coefficient in each of the 60 spectral intervals. If the spectral variation is not activated only the first line of each entry is used (although the others must be present).
The first entry is the material label; this should be between 100 and 199 for opaque solids, and between 200 and 299 for semi-transparent materials. The next two entries are the constant values of emissivity and reflectivity respectively. The rest of the line relates to the Monte Carlo model which is not part of this release.
A sample entry follows:
# Al=ALUMINIUM Data from E.D.Palik
100 0.1 0.9 0 0.000 0.000 0.000 0.000
1 99.000 0.000 0.000 0.000 0.000E+00 0.208E+03 0.000E+00 0.000E+00 1
1 99.000 0.000 0.000 0.000 0.000E+00 0.223E+03 0.000E+00 0.000E+00 2
1 99.000 0.000 0.000 0.000 0.000E+00 0.204E+03 0.000E+00 0.000E+00 3
1 99.000 0.000 0.000 0.000 0.000E+00 0.205E+03 0.000E+00 0.000E+00 4
1 99.002 0.000 0.000 0.000 0.000E+00 0.212E+03 0.000E+00 0.000E+00 5
1 98.991 0.000 0.000 0.000 0.000E+00 0.205E+03 0.000E+00 0.000E+00 6
.    .     .     .     .     .         .         .         .       .
.    .     .     .     .     .         .         .         .       .
4 0.120 0.000 0.000 0.000 0.000E+00 0.230E+01 0.000E+00 0.000E+00 55
4 0.095 0.000 0.000 0.000 0.000E+00 0.199E+01 0.000E+00 0.000E+00 56
4 0.075 0.000 0.000 0.000 0.000E+00 0.172E+01 0.000E+00 0.000E+00 57
4 0.059 0.000 0.000 0.000 0.000E+00 0.145E+01 0.000E+00 0.000E+00 58
4 0.046 0.000 0.000 0.000 0.000E+00 0.121E+01 0.000E+00 0.000E+00 59
4 0.035 0.000 0.000 0.000 0.000E+00 0.968E+00 0.000E+00 0.000E+00 60
For each spectral interval (numbered on the right hand end of the line) there are 8 real parameters. These are used to define the complex refractive index of the material, n + ik; the first 4 parameters relate to the real part and the second 4 to the imaginary part, as follows:
n = n0 + n1T* + n2T*2 + n3T*3
k = exp(k0T*) (k1 + k2T* + k3T*2)
where T* = (T-300)/1000. The spectral intervals cover the range of wavenumbers from 102 to 105 cm-1. The viewfactor approach splits the spectral range into a smaller number of bands within which the properties can be regarded as approximately constant; the numbers in the left hand column define appropriate bands for each material,
Users can add to the optical data file in order to simulate the behaviour of materials that are not already included, bearing in mind the compatibility with PRPS values. The version of the data file provided with the code demonstrates this: substances such as aluminium, which are included in the built-in PHOENICS property table, are given the same material number in the optical properties data file; others, such as tungsten, which are not, have been allocated higher numbers and their mate rial properties should be defined in the 'q1' file or by adding to the 'props' file.
4.6 Transport and thermodynamics data files (TRANSDAT and THERMDAT)
These data files are in the same format as that adopted by the CHEMKIN package. A sample from THERMDAT follows:
SIH4              121386SI  1H   4          G  0300.00   4000.00  1000.00    1
 0.06893873E+02 0.04030500E-01-0.04183314E-05-0.02291394E-08 0.04384766E-12  2
 0.11070374E+04-0.01749116E+03 0.02475166E+02 0.09003721E-01 0.02185394E-04  3
-0.02681423E-07-0.06621080E-11 0.02925488E+05 0.07751014E+02                 4
The first line contains the species name, a number which is not used and then the elemental composition of the species; the numbers at the end of the line are the low, high and transition temperatures respectively. The next three lines contain polynomial coefficients used to determine enthalpy, entropy and specific heat as a function of temperature within the two ranges thus defined. The first 7 parameters apply to the high temperature range and the remaining parameters to the lo w temperature range. An exception is made for adsorbed species in the Arora & Pollard surface chemistry model. In that case the high data are used instead for adsorption data and the high and transition temperatures are set equal.
An extract from TRANSDAT follows:
SIH4               2   207.6       4.084     0.000     0.000     1.000 ! mec
SIH3               2   170.3       3.943     0.000     0.000     1.000 ! mec
SIH2               2   133.1       3.803     0.000     0.000     1.000 ! mec
Here only the numbers in the third and fourth columns are used: they are the Lennard-Jones parameters e/k and
s respectively for the species named in the first column.As with the other data files, the user is expected to add entries for missing materials in the standard format. Note that the names of any species must be consistent in all data files in which they appear.