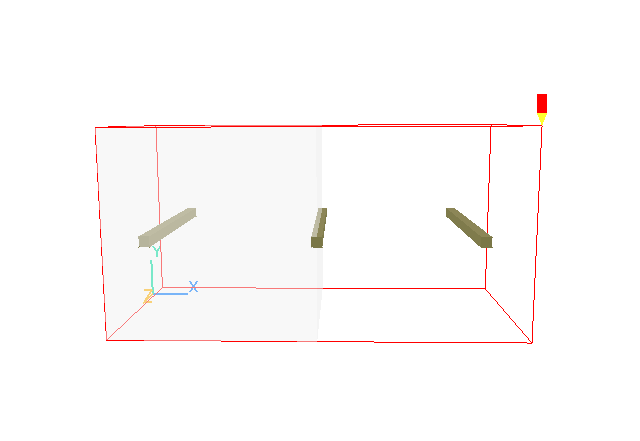
The workshop is concerned with the prediction of the transient flow and temperature distribution consequent on the abrupt rupture of a diaphragm.
A chamber is divided into a high-pressure and a low-pressure zone by a diaphragm. At time t=0, the diaphragm ruptures, initiating flow.
The chamber is 0.2m long, and .1m*.1m in cross-section. The high-pressure end is initially 1 bar above atmospheric pressure. Both ends have an initial uniform temperature of 23 oC.
In the first case, the entire diaphragm ruptures, in the second case only the central part disappears.
The simulation is two-dimensional and its geometry is shown below.

The geometry and simulation options are set up using VR Editor, the calculations are performed using the PHOENICS solver, EARTH, and the results are viewed using VR Viewer. Only temperature need be simulated.
We will use the X-Y plane for the calculation. This allows the Z axis to be used to display time in the VR-Viewer.
From the system level:
To enter the PHOENICS-VR environment, click on the PHOENICS icon on the desktop, or click on Start, programs, PHOENICS, PHOENICS.
From the commander level:
To enter the PHOENICS-VR environment, click on the 'Run vre' icon in the left column.
In PHOENICS-VR environment,
Start with an 'empty' case - click on 'File' then on 'Start New Case', then on 'Core'', then click on 'OK'; to confirm the resetting.
To enter VR Editor:
This is the default mode of operation.
Click on 'Main Menu'. Enter 'Complete diaphragm rupture' as the TITLE.
Set the domain size, grid and time steps:
Click on 'Geometry'.
Change the X-Domain Size to 0.2 m.
Change the Y-Domain Size to 0.1 m.
Change the Z-Domain Size to 0.1 m.
Set the number of cells in X to 40.
Set the number of cells in Y to 20.
Leave the number of cells in Z at 1.
Click on 'Steady' to toggle to 'Transient'.
Click on 'Time step settings'.
Set the 'Time at end of last step' to 0.001s.
Set the 'Last step number' to 100. This will produce time steps of 0.00001s each.
Click 'OK' to close the Time step settings dialog.
Click 'OK' to close the Grid mesh settings dialog.
Activate solution of variables:
Click on 'Models'.
Use default setting, 'Solution of Velocity and pressure', ON.
Click on 'energy equation' and select 'Temperature' as energy formulation. Click on 'Total' to toggle to 'Static'.
Set 'Turbulence models' to LAMINAR.
Set the material properties:
Click on 'Properties'
Click on the button next to 'The current domain material is:'. Select 'Gases' from the list of material types, then 'Air using Ideal gas Law' from the list of gases.
Note that by default the reference pressure and temperature are set to 1E5 bar and 273K respectively.
Set the 'Ambient temperature' to 23.
Set the solution control parameters:
Click on 'Numerics'
Set the Total number of iterations to 50. This is the number of iterations (sweeps) performed on each time step.
Set the output parameters:
Click on 'Output', then on 'Settings' next to Write flow field.
Set the 'Intermediate field dumps' to ON step frequency to 1 and leave the 'Start letter for solution file' as blank. This will instruct the Earth solver to create a special output file, in which the Z axis is time, and each Z plane is the X-Y solution at that time.
Click on 'Previous panel', 'Top menu' and then on 'OK'.
Click on the 'Reset' button, then 'Fit to window' to update the view.
Use the 'View down' button or mouse (click on 'Mouse' button first) on the handset to rotate the image so that you are looking at the X-Y plane.
Create the High Pressure end:
Click on 'Settings', 'New', 'New Object', 'Blockage'. The Object specification dialog box will appear
Change name to HIGH-P.
Click on 'Size' and set SIZE of object as:
Xsize: 0.1
Ysize: 'To end'
Zsize: 'To end'
Click on 'Place' and use the default settings as:
Xpos: 0.0
Ypos: 0.0
Zpos: 0.0
Click on 'General'.
Click on 'Attributes', then on 'Other materials'. Select domain material.
Click on 'Initial values'. Set the initial pressure to 'User', 1E5 (relative to 1E5).
Click on 'OK' twice to exit the Attributes menu and on 'OK' to exit the Object specification Dialogue Box.
Create probes:
Click on 'Settings', 'New', 'New Object', 'Point_history'.
Change name to PROBE.
Click on 'Size' and set SIZE of object as:
Xsize: 0.005
Ysize: 0.005
Zsize: 'to end'
Click on 'Place' and set the centre POSITION of the object as:
Xpos: 0.18
Ypos: 0.05
Zpos: 0.05
Click on 'OK' to exit from the Object Specification Dialogue Box.
Click on the 'Duplicate object' button on the hand set and 'OK' to confirm. Use the X-, Y-position down button on the main control panel to move the duplicate object to XPOS 0.1, YPOS 0.05.
Click on the PROBE object to select it
Click on the 'Duplicate object' button on the hand set and then 'OK' to confirm.
Move the duplicate object to XPOS 0.02, YPOS 0.05.
In the PHOENICS-VR environment, click on 'Run', 'Solver'(Earth), and click on 'OK' to confirm running Earth.
In the PHOENICS-VR environment, click on 'Run', 'Post processor',then GUI Post processor (VR Viewer) Viewer)'. Click 'No' next to 'Use intermediate files' to toggle to 'Yes', then click 'OK' to read the file.
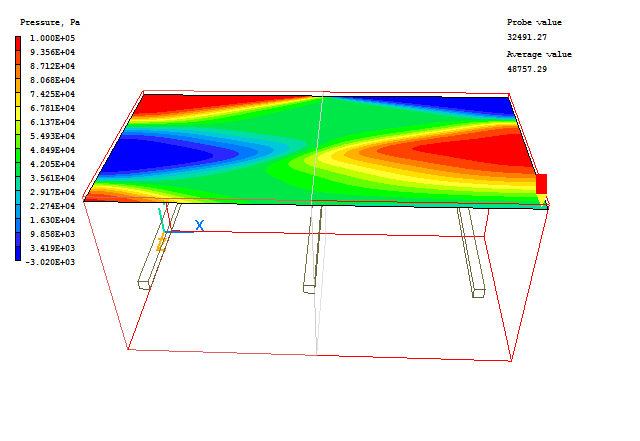
Note that the Z axis now represents time. Click on 'Reset' button, then 'Fit to window' to update the view.
Select Pressure as the plotting variable, and turn the Contours on.
Contours in the Z plane show the temperature distribution at a point in time.
Contours in the Y plane show time variations at particular Y locations.

Contours in the X plane show time variations at particular X locations.
Double-click on a probe object, and click the 'Options', then 'Show results' button on the object specification dialog. Select a variable, and the time-history of that variable will be displayed.
In the PHOENICS-VR environment, click on 'Save as a case', make a new folder called 'BURST' (e.g.) and save as 'CASE1' (e.g.).
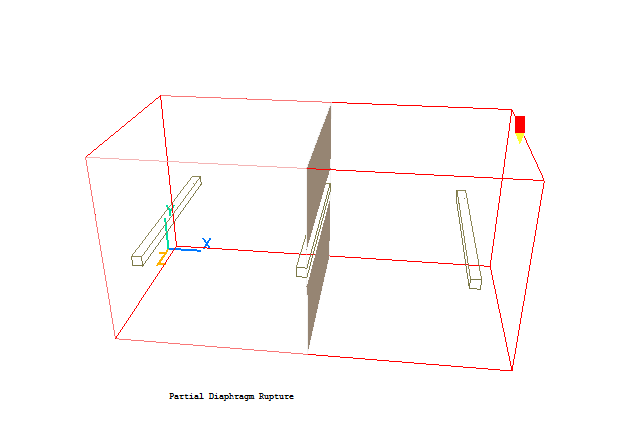
We will now assume that the diaphragm did not rupture completely. We can do this by introducing plates at the edge of the high-pressure region.

Click on 'Run - Pre processor - GUI Pre processor (VR-Editor)' to return to the Editor.
Click on 'Main Menu'. Enter 'Partial diaphragm rupture' as the TITLE. Click 'OK'.
Create the lower plate:
Click on 'Settings', 'New', 'New Object', 'Plate', and select the X plane for the plate to lie in.
Change name to PLATE1.
Click on 'Size' and set SIZE of object as:
Xsize: 0.0
Ysize: 0.04
Zsize: 'To end'
Click on 'Place' and set POSITION of object as:
Xpos: 0.1
Ypos: 0.0
Zpos: 0.0
Click on 'OK' to close the Object specification dialog.
Create the upper plate:
Click on 'Duplicate object' and then 'OK' to confirm.
Change the position of the duplicated object to XPOS=0.1, YPOS=0.06.
In the PHOENICS-VR environment, click on 'Run', 'Solver'(Earth), and click on 'OK' to confirm running Earth.
In the PHOENICS-VR environment, click on 'Run', 'Post processor',then GUI Post processor (VR Viewer) Viewer)'. Click 'No' next to 'Use intermediate files' to toggle to 'Yes', then click 'OK' to read the file.
Click on 'Reset' button and then 'Fit to window' to update the view.
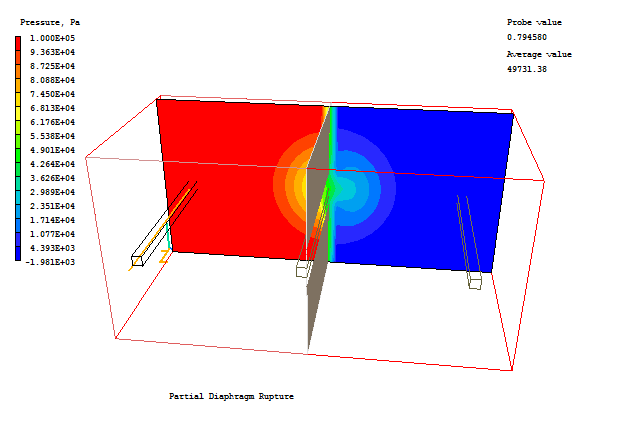
Select Pressure as the plotting variable, Z as the plotting plane and turn the Contours on.
Contours in the Z plane show time variations at particular times - in this case near the start of the transient.

In the PHOENICS-VR environment, click on 'Save as a case', and save as 'CASE2' (e.g.). in the folder 'BURST' (e.g.)