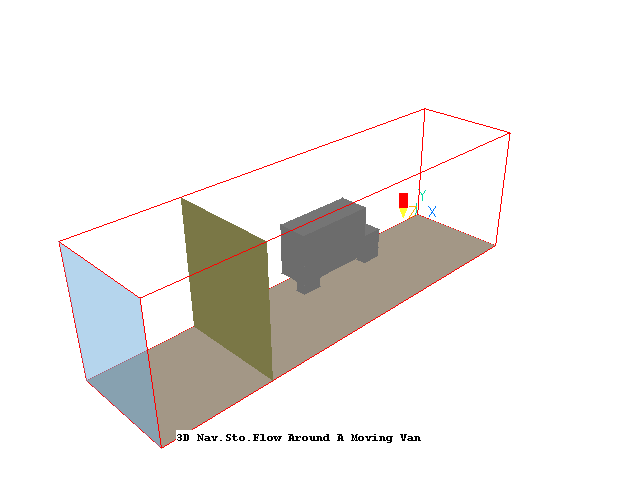
For this workshop you can load and modify case 274 from the core library. The basic case models the isothermal flow of air past a moving van. The movement of the van is represented by giving the floor plane the same velocity as the air inlet.
InForm is a feature which enables users of PHOENICS greatly to extend its capabilities, without the introduction of new coding.
Users are enabled to express their requirements by way of formulae. These are read by the Input Module (Satellite), which transmits them to the Solver Module (EARTH); this then interprets them and performs the implied computations.
Unlike PLANT, its predecessor in functionality, In-Form does not require use of a re-compilable version of PHOENICS.
Many objects types have a button labeled 'InForm Commands' on their attributes page. This leads to a dialog from which a selection of InForm commands can be attached to the current object. The usual format of an InForm command is as follows:
(KEYWORD of VARIABLE at LOCATION is FORMULA with CONDITION)
The workshop will show how to use InForm to calculate an average value over an area, and then produce a table showing how this value changes with iteration.
From the system level:
To enter the PHOENICS-VR environment, click on the PHOENICS icon on the desktop, or click on Start, programs, PHOENICS, PHOENICS.
In PHOENICS-VR environment,
Click on 'File', 'Load from Libraries', enter 274 in the Case Number data entry box, and click 'OK'.
We want to calculate the average Z-directed velocity at a plane located at Z=15m, covering the whole domain. At this plane, we want to calculate the area-averaged Z-directed velocity (W1). This is given by:
Wave = S(W1 * Ahigh)/S(Ahigh)
where Ahigh is the Z-directed cell-face area.
Firstly, we create an object at the location where we want to do the summations. Click 'Settings', 'New', New object'.
Set the Size to:
Xsize: 'To end'
Ysize: 'To end'
Zsize : 0.0
Set the position to:
Xpos: 0.0
Ypos: 0.0
Zpos: 15.0
Click 'Options' and clear the tick from 'Object affects grid'. We do not want to change the existing grid distribution.
Click 'General', and set the object type to 'User_defined'. Change the name to AVEW1.
Click 'Attributes' to open the Object settings dialog for this object, and then click 'Edit InForm 13'. This will open the Inform Save Block Editor which is used to insert or modify InForm commands.
In between the save13begin and save13end lines, type the following:
   save13begin
(make totar is 0.0)
(make w1tot is 0.0)
(store1 of totar at avew1 is sum(ahigh))
(store1 of w1tot at avew1 is sum(w1*ahigh))
(print of w1bar is w1tot/totar)

(table in monplt.csv is get(w1tot/totar, w1{1,1,15}) with head(wbar, w1-1)!sweep)
   save13end
The meaning of these lines is as follows:
(make totar - create a single variable which will hold the total area, and initialise to zero.
(make w1tot - create a single variable which will hold the velocity times area sum, and initialise to zero.
(store1 of totar... sum the high area over the extent of object avew1
(store1 of w1tot... sum the product of W1 velocity and high area over the extent of avew1
(print of w1bar ... print the average velocity into the INFOROUT file
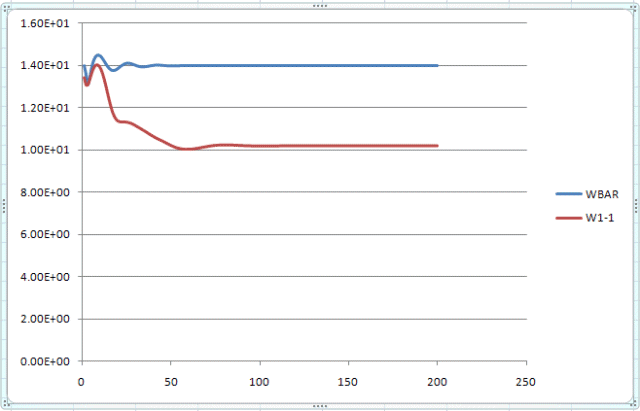
(table in monplt.csv is ... create a file called monplt.csv containing three columns. The first is the sweep number, the second is the average velocity, and the third is the actual velocity at the physical location (1.0,1.0,15.0). The headings of the columns will be ISWEEP,WBAR and W1-1,
Click File, Save current block, then File, Exit.
The screen should look like this:

In the PHOENICS-VR environment, click on 'Run', 'Solver'(Earth), and click on 'OK'; to confirm running Earth.
Inforout
To see the final average velocity printed to INFOROUT by the (print command, click File, Open file for Editing, INFOROUT. The file should look like this:
************************************************************
IRUN = 1 LIBREF = 274
ISTEP = 1 ISWEEP = 200
W1BAR = 1.400000E+01
************************************************************
Monplt.csv
The convergence monitoring file, monplt.csv can be opened directly in Excel, if that is available on the computer. In Windows Explorer, browse to the current working directory (by default \phoenics\d_priv1). Double-click on monplt.csv. Excel should open. Using the chart wizard create a 'scatter' plot with ISWEEP as the X axis and W1BAR, W1-1 as the Y axes. The resulting plot should look like this:

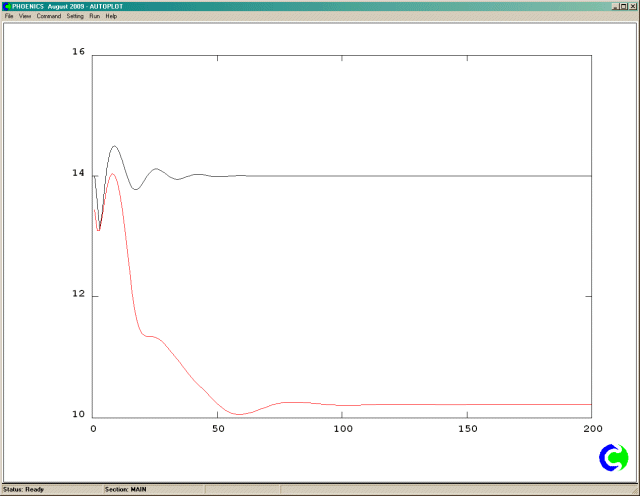
The monplt.csv file can also be plotted in the AUTOPLOT program. Click Run, Post-processor, X-Y graph plotter (Autoplot). When Autoplot start up, click File, Data files, Add. Enter monplt.csv in the file name box, and select the 'Table file' radio button. Click Add. Monplt.csv will appear in the list of Opened files. Click Close.
Click Command, Datas, Add. Select ISWEEP for X, and WBAR for Y. Click Plot. repeat for ISWEEP as X and W1-1 as Y. Choose a red colour before clicking Plot. The graph should look like this:

As can be clearly seen, both the local and average velocities are converged after 100 sweeps.
In the PHOENICS-VR environment, click on 'Save as a case', make a new folder called 'INFORM ' (e.g.) and save as 'CASE4' (e.g.).