Encyclopaedia Index
FLAIR Tutorial 9: Fire-spray in a compartment
This example provides step-by-step instructions on how to activate GENTRA module, which
solves the dispersed phase equations using Lagrangian methods and how to load and define
the spray-head object for the simulation of fire extinction. In-Form is used to define the
transient fire source which is the function of time and the concentration of the water
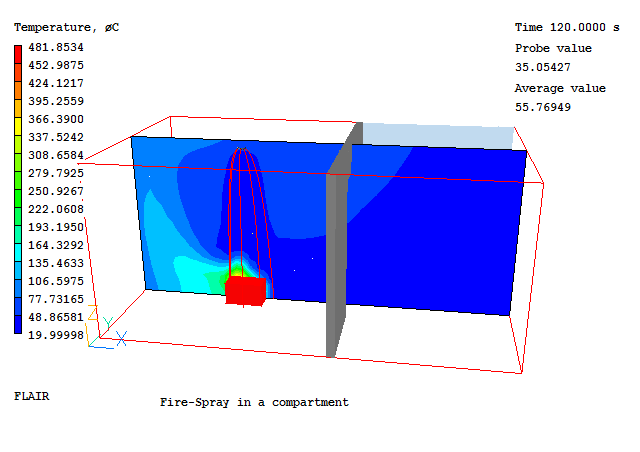
vapour. The geometry of the case is shown in the figure below.
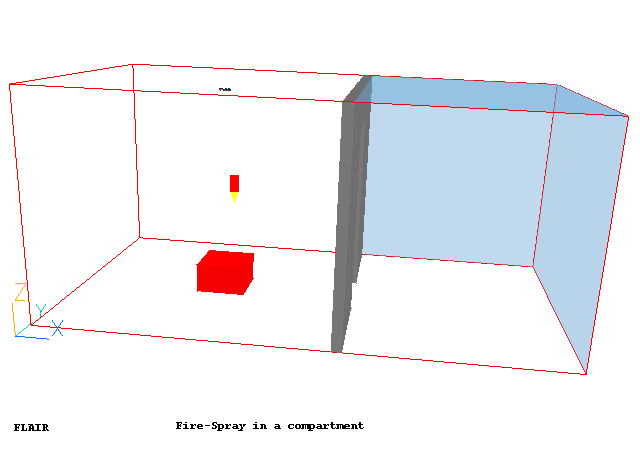
The size of the compartment is 2.8m long x 2.8 m wide x 2.2 m high. A sprinkler is
mounted at the ceiling of the middle of the compartment. A fire source is located on the
floor facing the sprinkler. There is a wall on the right with a door to the open space.
The simulation starts with a growing fire source before the water spray starts when the
spray link temperature exceeds 50C. The entire simulation lasts for 120 seconds.
Setting up the model
Start FLAIR with the default mode of operation
Resizing the domain
- Change the size to 5m in x-direction, 2.8m in y-direction and 2.2m in z-direction on the
control panel.
- Click on "Reset" button,
 on the movement panel and then click "Fit to window".
To activate the physical models
a. The Main Menu panel
- Click on the 'Main Menu' button. The top page of the main menu will appear on the
screen.
- Click on the 'Title' dialogue box. Then type in 'Fire-spray in a compartment'.
- Click on 'Geometry' to obtain the Grid Mesh Settings dialog.
- Change 'Time dependence' from Steady to Transient.
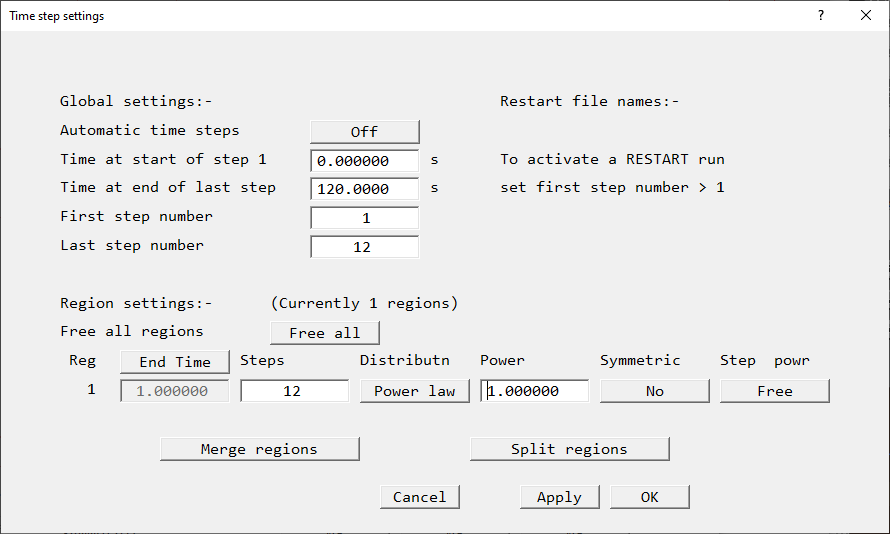
- Click on 'Time step settings' and set the input as shown below
- Click on 'OK' twice to close the 'Geometry' panel.
- Click on 'Models' to obtain the Model menu page.
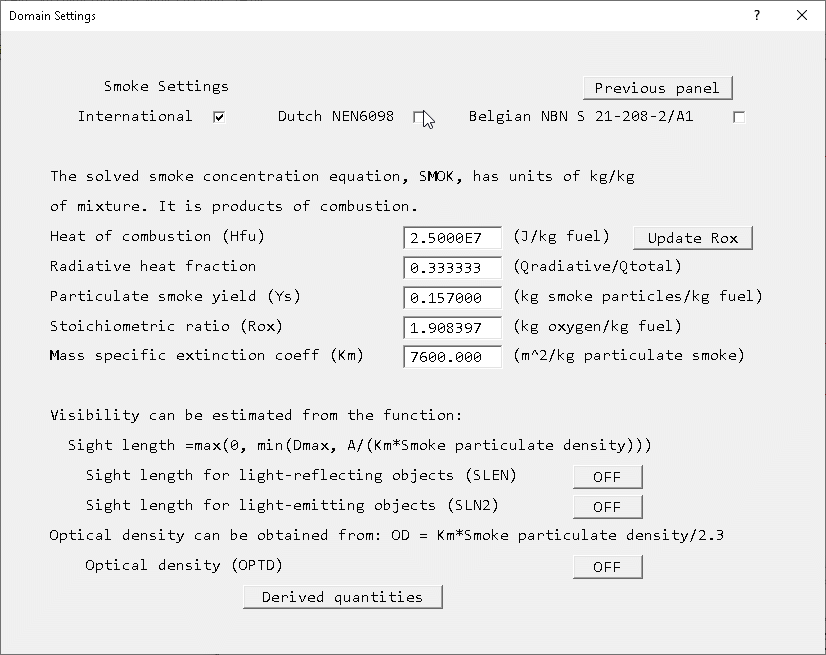
- Switch 'Solve smoke mass fraction' to 'ON' and then 'click on its 'settings'
- This panel is where the heat of combustion and particulate smoke yield are set. See TR/313 Section
4.6 or the on-line help for descriptions of the settings on this panel.
The CIBSE Guide E (2003) provides the following data:
| Material |
Hfu (MJ/kg) |
Yco (kg/kg) |
Ys (kg/kg) |
| Timber |
13.0 |
0.020 |
<0.01 - 0.025 |
| PVC- Polyvinyl chloride |
5.7 |
0.063 |
0.12 - 0.17 |
| PU- Polyurethane (flexible) |
19.0 |
0.042 |
<0.01 - 0.23 |
| PU- Polyurethane (rigid) |
17.9 |
0.18 |
0.09 - 0.11 |
| PS- Polystyrene |
27.0 |
0.060 |
0.15 - 0.17 |
| PP- Polypropylene |
38.6 |
0.050 |
0.016 - 0.1 |
If the fire is to represent burning timber, set the 'Heat of Combustion'
to 1.3E7 and the 'particulate smoke yield' to 0.02. Click 'Update Rox' to bring the
stoichiometric ratio in line with the new heat of combustion.
- Switch 'Sight length for light-reflecting objects (SLEN)' to 'ON'.
- Click on 'Previous panel'.
- Click on 'Top menu' and 'OK' to close the main menu.
- Adding the object to the calculation domain
b. add the spray-head
- Click on the 'Object' pull-down menu and select the 'New' (New Object), 'Sprayhead' option on the
'Object management' dialog box to bring up the 'Object specification' dialog box.
- Click on 'OK' to activate GENTRA.
- Change 'Name' to 'Spray'
- Click on 'General' and then click on 'attributes'.
- Set the 'Spray position' to 1.49 in X, 1.4 in Y and 2.1 in Z. This sets the position of
the centre of the spray head.
- Set the 'Spray radius' to 0.05. The size and position of the object will be updated when
the Object Specification dialog is closed.
- Change 'Activate all the time' from 'Yes' to 'Auto-on'. New buttons relating to the link
temperature calculation will appear. Set 'Activation temperature' to 50 C. Leave the spray
duration as 120 s, as this will ensure the spray does not stop.
- Set the rest of input as shown below. Please refer to TR/313 Section 3.1.4 for
the definition of each entry.
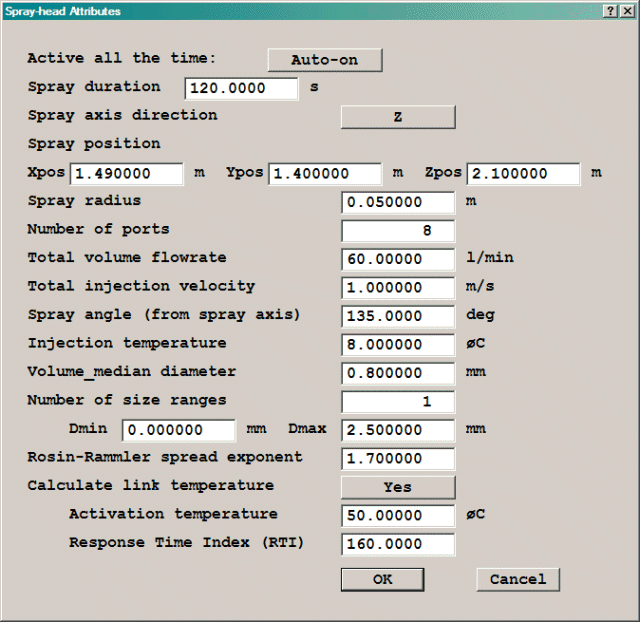
- Click on 'OK' to return to the 'Object management' dialog box. The GENTRA particle
Tracker will be turned on automatically, with all the correct settings for the spray
model. Only the spray start and end-times need to be set.
c. add the fire source
The heat source Q is a function of time (tim) and the local water vapour mass fraction
(MH2O). As long as the MH2O values are near zero, the expression gives a t2
fire growth. The constant 46.9 is appropriate for a 'fast' fire. Once MH2O increases, the
strength of the fire is reduced. A -500 multiplier is used to determine how much the source is
reduced.
- Click on the 'Object' pull-down menu and select the 'New' (New Object), 'Fire' option on the
'Object management' dialog box to bring up the 'Object specification' dialog box.
- Change 'Name' to 'Fire'.
- Click on the 'Size' button and set 'Size' of the object as:
X: 0.5 m
Y: 0.5 m
Z: 0.3 m
- Click on the 'Place' button and set 'Position' of the object as:
X: 1.25 m
Y: 1.125 m
Z: 0.0 m
- Click on 'General' and then 'attributes'.
- Click on 'In-Form Commands'. The Inform Sources dialog will appear.
- Click 'Add Inform'.
- Click the empty button under 'Keyword' and select SOURCE.
- Click the empty button under 'Var' and select TEM1.
- Click the empty button under 'Formula'. An editing window will appear. In the input
window, type
(exp(-500.*MH2O)*46.9*tim)*tim
then click 'File', 'Save & Exit'. An explanation of the settings made is given
shortly!
- Click the empty button under 'Condition'. An editing window will appear. In the
input window, type
whol
then click 'File', 'Save & Exit'.
- Click 'Add Inform' again.
- Click the empty button on the second row under 'Keyword' and select SOURCE.
- Click the empty button under 'Var' and select P1.
- Click the empty button under 'Formula'. An editing window will appear. In the input
window, type
(exp(-500.*MH2O)*46.9*tim)*tim*(1+rox)/hcomb
then click 'File', 'Save & Exit'.
- Click the empty button under 'Condition'. An editing window will appear. In the
input window, type
whol
then click 'File', 'Save & Exit'.
- Click 'Add Inform' again.
- Click the empty button on the second row under 'Keyword' and select SOURCE.
- Click the empty button under 'Var' and select SMOK.
- Click the empty button under 'Formula'. An editing window will appear. In the input
window, type
1
- Click the empty button under 'Condition'. An editing window will appear. In the
input window, type
onlyms
then click 'File', 'Save & Exit'.
- The In-Form Sources dialog should now look like this:

Please note that the above function is only for the purpose of demonstration. InForm is
used to show how the local vapour concentration (MH2O) can be used to reduce the heat
source from the fire.
The first line sets the mass source as Q*(1+stoichiometric ratio)/(heat of combustion),
where rox and hcomb are the internal menu names. The second line sets the heat source, and
the last line sets the mass fraction of combustion product in the incoming stream to 1.
The 'whol' qualifier means that the source is a total source for the object. The 'onlyms'
qualifier means that the quantity set by the source is convected in by the associated mass
source. For more information on InForm, click here.
- Click on 'OK' and 'OK'.
d. create the wall with a door
The wall is made of three blockages.
- Click on the 'Object' pull-down menu and select the 'New' (New Object), 'Blockage' option on the
'Object management' dialog box to bring up the 'Object specification' dialog box.
- Change 'Name' to 'BLK1'
- Click on the 'Size' button and set 'Size' of the object as:
X: 0.1 m
Y: 1.03 m
Z: tick 'to end'
- Click on the 'Place' button and set 'Position' of the object as:
X: 2.8 m
Y: 0.0 m
Z: 0.0 m
- Click on 'OK' to exit from the object specification dialog.
- Click on the 'Object' pull-down menu and select the 'New' (New Object) option on the
'Object management' dialog box to bring up the 'Object specification' dialog box.
- Change 'Name' to 'BLK2'
- Click on the 'Size' button and set 'Size' of the object as:
X: 0.1 m
Y: 1.05 m
Z: tick 'to end'
- Click on the 'Place' button and set 'Position' of the object as:
X: 2.8 m
Y: tick 'at end'
Z: 0.0 m
- Click on 'OK' to exit from the object specification dialog.
- Click on the 'Object' pull-down menu and select the 'New' (New Object), 'Blockage' option on the
'Object management' dialog box to bring up the 'Object specification' dialog box.
- Change 'Name' to 'BLK3'
- Click on the 'Size' button and set 'Size' of the object as:
X: 0.1 m
Y: 0.72 m
Z: 0.37 m
- Click on the 'Place' button and set 'Position' of the object as:
X: 2.8 m
Y: 1.03 m
Z: tick 'at end'
- Click on 'OK' to exit from the object specification dialog.
e. add the wall on the high-Y side
- Click on the 'Object' pull-down menu and select the 'New' (New Object), 'Plate' and select Y plane on the
'Object management' dialog box to bring up the 'Object specification' dialog box.
- Change 'Name' to 'WALL1'
- Click on the 'Size' button and set 'Size' of the object as:
X: 2.8 m
Y: 0.0 m
Z: tick 'to end'
- Click on the 'Place' button and set 'Position' of the object as:
X: 0.0 m
Y: tick 'at end'
Z: 0.0 m
- Click on 'General' then 'Attributes'.
- Change 'Energy source' from 'Adiabatic' to 'Surface temperature' and enter the value to
20°C
- Click on 'OK' twice to close the object specification dialog box.
f. add the wall on the low-Y side
This wall is made by the duplicating method.
- Click on the wall object, WALL1
- Click on the ' Duplicate object' button on the control panel and 'OK' to confirm the
action.
- Move the position of the duplicated object to:
X: 0.0 m
Y: 0.0 m
Z: 0.0 m
- Double click on the duplicated object to bring up the object specification dialog box.
- Change the 'Name' to WALL2 and click on 'OK'.
g. add the wall on the low-X side
- Click on the 'Object' pull-down menu and select the 'New' (New Object), 'Plate'and select X plane on the
'Object management' dialog box to bring up the 'Object specification' dialog box.
- Change 'Name' to 'WALL3'
- Click on the 'Size' button and set 'Size' of the object as:
X: 0.0 m
Y: tick 'to end'
Z: tick 'to end'
- The 'Position' of the object will be left to its default :
X: 0.0 m
Y: 0.0 m
Z: 0.0 m
- Click on 'General' and 'Attributes'.
- Change 'Energy source' from 'Adiabatic' to 'Surface temperature' and enter the value to
20° C
- Click on 'OK' twice to close the object specification dialog box.
h. add the floor
- Click on the 'Object' pull-down menu and select the 'New' (New Object), 'Plate' and select Z plane on on the
'Object management' dialog box to bring up the 'Object specification' dialog box.
- Change 'Name' to 'FLOOR'
- Click on the 'Size' button and set 'Size' of the object as:
X: tick 'to end'
Y: tick 'to end'
Z: 0.0 m
- The 'Position' of the object will be left to its default :
X: 0.0 m
Y: 0.0 m
Z: 0.0 m
- Click on 'General' and on 'Attributes'.
- Change 'Energy source' from 'Adiabatic' to 'Surface temperature' and enter the value to
20°C
- Click on 'OK' to close the object specification dialog box.
i. add the ceiling
This is made by the duplicating method.
- Click on the plate object, FLOOR
- Click on the ' Duplicate object' button on the control panel and 'OK' to confirm the
action.
- Move the position of the duplicated object to:
X: 0.0 m
Y: 0.0 m
Z: tick 'at end'
- Change the X size of the duplicated object to 2.8m.
- Double click on the duplicated object to bring up the object specification dialog box.
- Change the 'Name' to CEILING and click on 'OK'.
j. add the openings
These objects will provide the boundary conditions to the open space.
k. To set the grid numbers and to solver parameters
| Variable |
MH2O |
TEM1 |
| LINEAR |
0.3 |
0.25 |
| MAXINC |
0.5 |
10 |
Running the solver
To run the PHOENICS solver, Earth, click on 'Run', then 'Solver', then click on 'OK' to
confirm running Earth. These actions should result in the PHOENICS Earth monitoring
screen.
As the Earth solver starts and the flow calculations commence, two graphs should appear
on the screen. The left-hand graph shows the variation of solved variables at the
monitoring point that was set during the model definition. The right-hand graph shows the
variation of errors as the solution progresses.
Viewing the results
Saving the case
Once a case has been completed, it can be saved to disk as a new Q1 file by 'File -
Save working files'. The Q1 and associated output files can be saved more permanently by
'File - Save as a case'.


