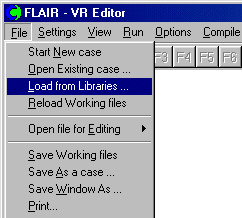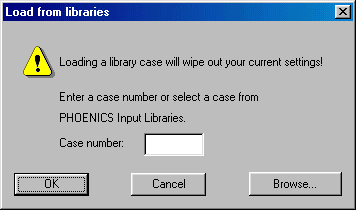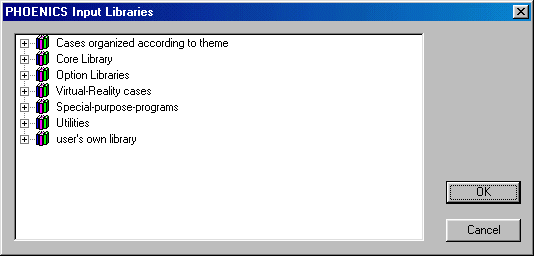

This tutorial is to illustrate how to load case I203, Ventilation of Hackney Hall from the FLAIR library and investigate its settings, run the case and view the results. However, this is a 3D real application and the user does not have to run through the case as it may take a few hours to complete.
Starting FLAIR with the default room
The FLAIR VR-Environment screen should appear, which shows the default room with the dimensions 10mx10mx3m.
Loading the library case I203


- The case was three dimensional, and the flow was steady.
- The geometry within the domain was created using PHOENICS-VR. As the auditorium was very nearly symmetrical, only half of the domain was modelled.
- The theatre includes balconies modelled as a series of stepped Cartesian blockages, and a new object was created to model the curved roof and stage.
- The computational domain is 33m long by 11.4m wide by 12.7m high, a 60*20*78 cells Cartesian grid was used, and PARSOL technique was used to map the non- Cartesian elements of the geometry; e.g. the curved roof and stage.
- The domain is filled with air, and ideal gas law was used in calculating pressure-temperature-density relationships. The roof, floors and walls were modelled using an adiabatic solid material.
- The effects of gravity were included by way of sources of momentum in the equations for the z component velocity using the built in buoyancy facilities available in PHOENICS.
- The Standard-KE model of turbulence is used to close the Reynolds-averaged Navier-Stokes equations.
- The air supply under the balcony, on the long side of the theatre, is introduced at 12degC. The incoming air velocity, from this long, slot is fixed at 3m/s, giving a mass flow rate of about 2.5m3/s.
- Further air is supplied under the seating, at the rear of the auditorium only, at 18degC. The inflow supply rate is 0.7m3/s, providing by seven 70mm high inlets.
- The occupant and light gains were modelled using heat sources respectively equivalent to 145W/m2 and 50W/m2.
- The ten outlets at the top of the domain were modelled as 500mm long by 250mm wide fixed pressure openings.

This case was to simulate the air flow and thermal characteristics in the theartre influenced by the ventilation system.
Investigating the model settings
 . You will see
all the objects listed on the object management dialog box as shown below.


 and click on
each model panel, for example 'Models' as shown below. As can be seen, the pressure,
velocities and temperature are solved. The constant effective turbulence viscosity is used
for the turbulence modelling.
Running the solver

As the Earth solver starts and the flow calculations commence, two graphs should appear on the screen. The left-hand graph shows the variation of solved variables at the monitoring point that was set during the model definition. The right-hand graph shows the variation of errors as the solution progresses.
A 3D real application like this requires about 30 minutes of computing time on a 3.5Ghz PC.
Viewing the results


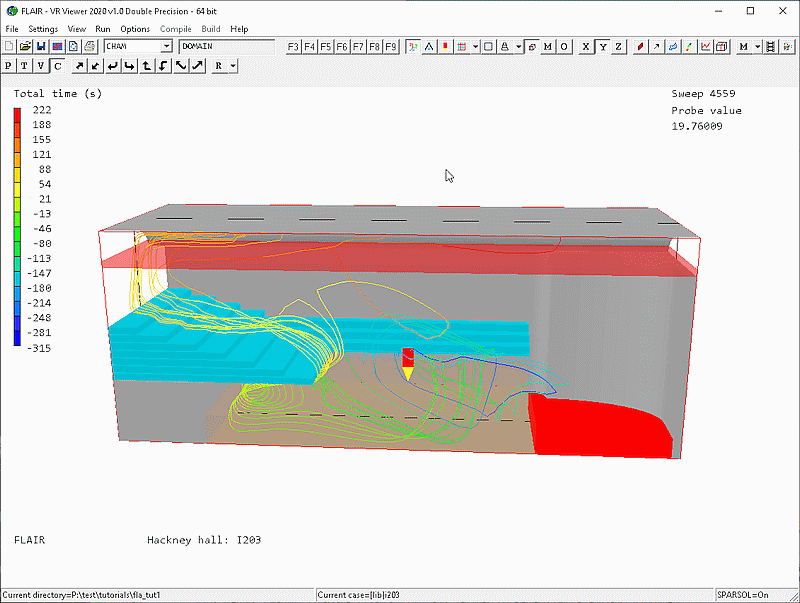
The following streamlines will be displayed on the screen.
