Encyclopaedia Index
WORKSHOP - CAD Import: Flow Over Multiple STL Files
Overview
The tutorial is a continuation of 'CAD Import: Importing Multiple STL
Files'.
In the earlier tutorial, multiple STL files for a complex building geometry were
imported. An obvious error in one of the imported file was repaired. In this final stage,
the imported STL files are moved to their final positions, the grid is set, boundary
conditions are added and a preliminary solution is obtained.
The full geometry of the case is shown in Figure 1 below.
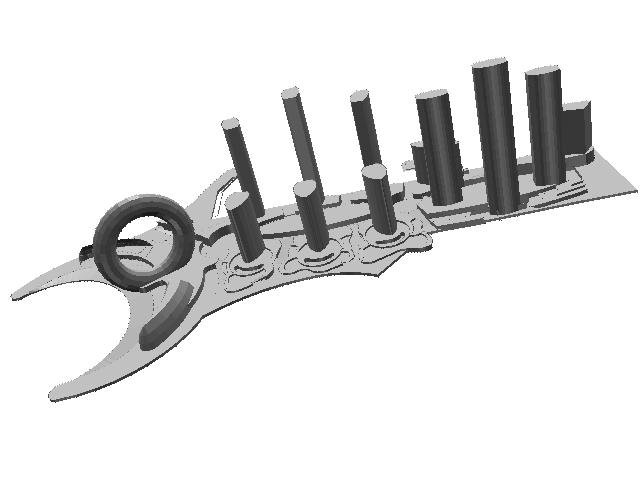
Figure 1. The geometry of the CAD import example
A complete step-by-step guide, showing how to set the case from the default mode of
operation, is provided below.
Accessing PHOENICS-VR.
From the system level:
To enter the PHOENICS-VR environment, click on the PHOENICS icon on the desktop, or
click on Start, programs, PHOENICS, PHOENICS.
From the commander level:
To enter the PHOENICS-VR environment, click on the 'Run vre' icon in the left column.
In PHOENICS-VR environment,
Start with the previous case - click on 'File' then on 'Open existing case', then
select CAD\STAGE_2.Q1. If starting this tutorial from scratch, library case 664 can be
used instead.
To enter VR Editor:
This is the default mode of operation.
Within VR Editor.
Position the STL files
A plan view of the domain shows this:
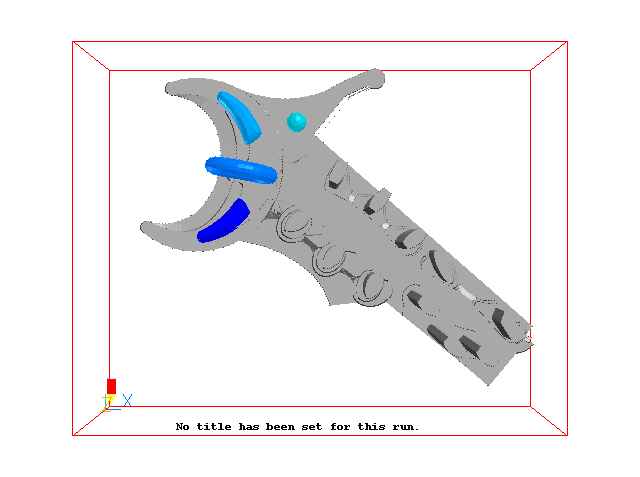
The domain is not really big enough, and the buildings are not central enough. Ideally,
we want the edges of the domain far enough away from the buildings so that the boundary
conditions imposed there do not influence the solution around the buildings.
Resize the domain
- To make the domain bigger, select the domain in the Object Management Dialog then enter
1400 in the X Size box on the hand-set, 1100 in the Y Size box and 500 in the Z Size box.
The domain will now be bigger, but the buildings will be even more off-centre.
- 'Reset' - 'Fit to window' will be needed to resize the graphics image so that all the
domain is visible.
Move the buildings
- On the Object Management dialog, highlight the wheel object. Right-click with the mouse
over the 'Type' column, and select 'Select all BLOCKAGES' from the context menu.
- Right-click again, and this time un-tick 'Object constrained by domain'. This will allow
us to move the buildings down so that their base is at Z=0. (The wheel sticks out below
the ground level).
- The 'Position' boxes on the hand-set show the position of the first object in the
selected group - in this case the wheel. When we move this, all the other selected objects
will be shifted by the same amount.
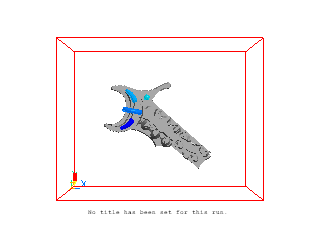
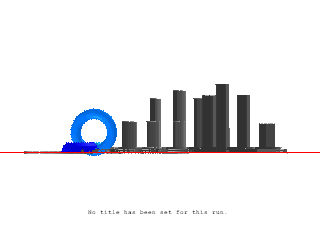
- Enter 250 into the X position box. Enter 150 in the Y Position box, and -10 in the Z
Position box. The geometry should now look like this:
Check and set the grid
- Click on the Mesh toggle
 on the hand-set or toolbar, then click on the image to bring up
the Grid mesh Settings dialog. The grid from the previous tutorial should look like this:
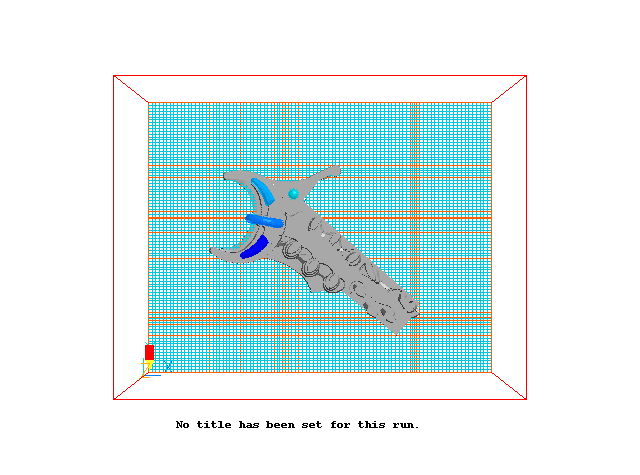
- This is not too bad, but can be improved. We can remove some cells from the outer
regions in X and Y, and let them be used within the buildings.
- Click on the mesh itself to bring up the Grid Mesh Settings dialog. Change the tolerance
from 0.001 to 0.5. Any lines closer together than 0.5m will be merged.
- Click on 'X direction to see the region settings in X.
- Change the Number of cells to 150.
- Using the '<<' and '>>' buttons go to X region 1. Set the number of cells t
15, and the power to -1.3. Now go to X region 15 and set 15 cells with a power of 1.3.
Click 'OK'.
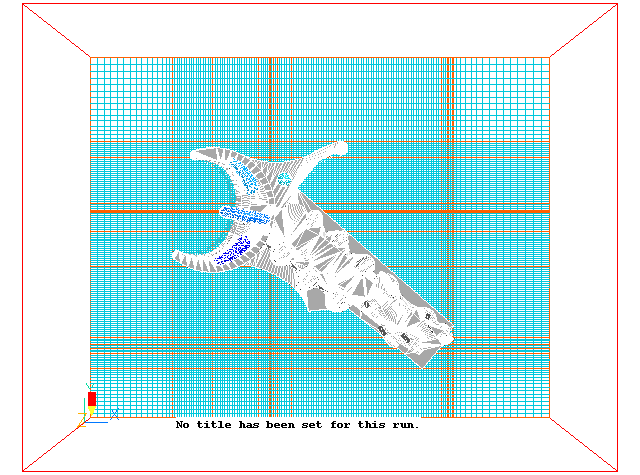
- Click on 'Y direction and make the same changes. The negative power causes the grid to
expand away from the far end of the region. A positive power expands away from the start
of the region. The X-Y grid should look like this:
- Click on 'Z direction'. Go to the last region in Z and set 15 cells with a power of 1.3
- Click on 'Settings' next to 'Partial solids treatment'. Change the Minimum volume
fraction to 0.025 and the maximum volume fraction to 0.975. This will ensure that cells
which are nearly closed or nearly open are treated as closed or open, and prevent spurious
pressure troughs and peaks in trapped cells.
Add the boundary conditions
Set Wind profile inlets at left and lower boundaries, pressure boundaries
at the right and upper boundaries, and the friction boundary on the ground plane.
- On the object management dialog click 'Object','New','New object','Wind'. Change the name to
WIND.
- You do not need to set the size or
position, as the WIND object automatically fits the domain. Click on 'Attributes'.
- Set the 'Wind direction' to 'South-West' (225° from North). The angle between the Y axis and North is
defaulted to 0, so in the image above Y is pointing North. The wind is therefore blowing
in from the bottom-left, and exiting from the top-right. The WIND object will create
inflow boundaries on the left and lower domain edges (x=0 and y=0), and pressure
boundaries on the top and right edges (x=max and y=max). Leave the wind speed at 10m/s,
and the reference height as 10m.
- Set 'Include ground plane' to Yes. This will apply the appropriate friction conditions
to the Z=0 plane.
- 'Include open sky' is defaulted to 'No', so the sky boundary (z=max) will be treated as
a frictionless no-flow boundary. If it were to be set tto 'yes', the sky (z=max) would be
treated as another pressure boundary.
- Click 'OK' to close the dialog.
Place the probe
The probe is used to monitor convergence of the solver. It should be placed away from
inlets and near outlets.
- Click the probe icon
 on the toolbar, then set the probe position to 800 in X, 700 in Y and 5 in Z.
Set solver parameters
This is a large case, and will take some time to run. The 100 iterations set by default
may take around an hour to complete, depending on the speed of the computer. A fully
converged run will take 1000-1500 sweeps, and should be considered as an 'overnight' run.
- On the main Menu, go to the 'Numerics' page. Set the 'Total number of iterations' to
100.
- On the Top page, set the Title to 'Flow around buildings'. Click 'OK' to close the main
menu.
Running the solver
To run the PHOENICS solver, Earth, click on 'Run', then 'Solver', then click on 'OK' to
confirm running Earth. These actions should result in the PHOENICS Earth monitoring
screen.
As the Earth solver starts and the flow calculations commence, two graphs should appear
on the screen. The left-hand graph shows the variation of solved variables at the
monitoring point that was set during the model definition. The right-hand graph shows the
variation of errors as the solution progresses.
Viewing the results
Once the Solver run has finished, enter the VR-Viewer to examine the solution (Click
'Run' - 'Post processor' ,'GUI ').
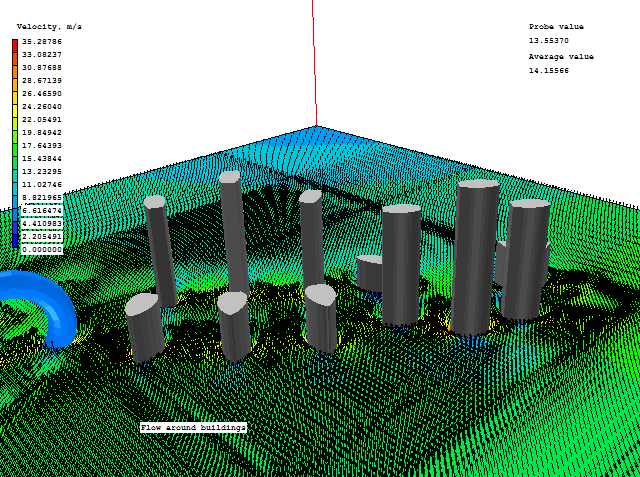
In the Viewer, switch the plotting plane to Z (click Z on the handset or toolbar), and
select the Velocity variable by clicking the  icon on the
hand-set or toolbar. Switch the contours on by clicking
  on the hand-set
or toolbar.
Saving the results.
In the PHOENICS-VR environment, click on 'Save as a case', make a new folder called
'CAD', select the new folder, and save as 'STAGE_3.


![]() icon on the
hand-set or toolbar. Switch the contours on by clicking
icon on the
hand-set or toolbar. Switch the contours on by clicking ![]() on the hand-set
or toolbar.
on the hand-set
or toolbar. 