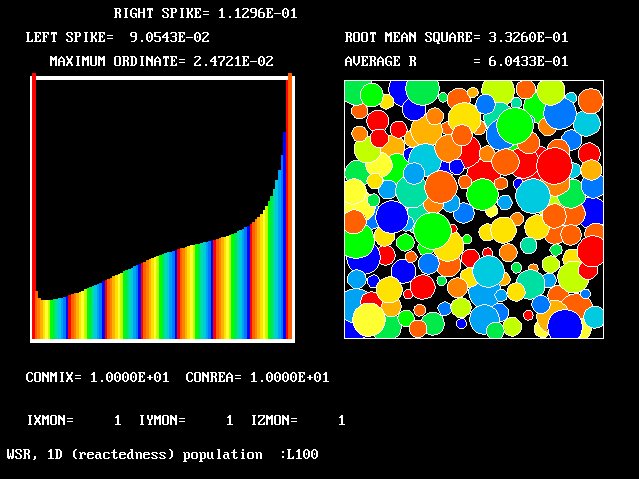
 This PDF is not unlike the 2-spike EBU presumption
                                                  _____|_____
 In the first example, it will be supposed        |     |     |
 that stream 1 is fully unreacted, that      1 ====>    |     |
 stream 2 is fully reacted, that 98 fluids        |  stirred  |
 of intermediate reactedness are created by       |  ///|/// 3===>
 micro-mixing and reaction (non-linearly          |  reactor  |
 dependent on reactedness) and that the      2 ====>          |
 outflowing stream 3 consists of 100 fluids       |___________|
 altogether, in to-be-computed proportions.
The flow is steady. Three cases will be shown, with mixing and reaction constants respectively = 10 & 10, 50 & 10, and 50 & 20.
 This PDF is not unlike the 2-spike EBU presumption
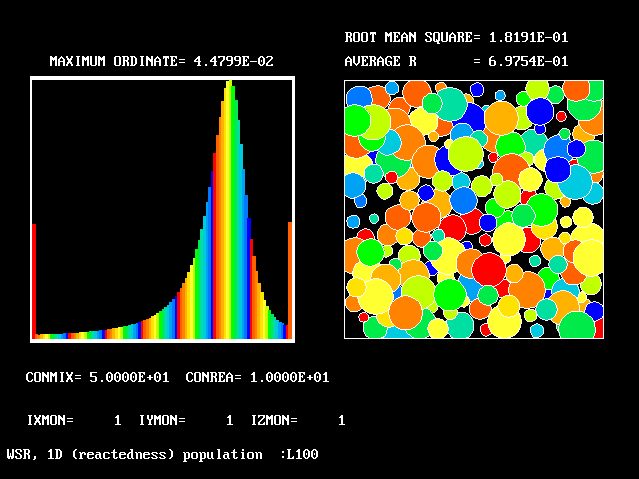 With increased mixing constant, the
PDF is not unlike an unsymmetrical "clipped-Gaussian"
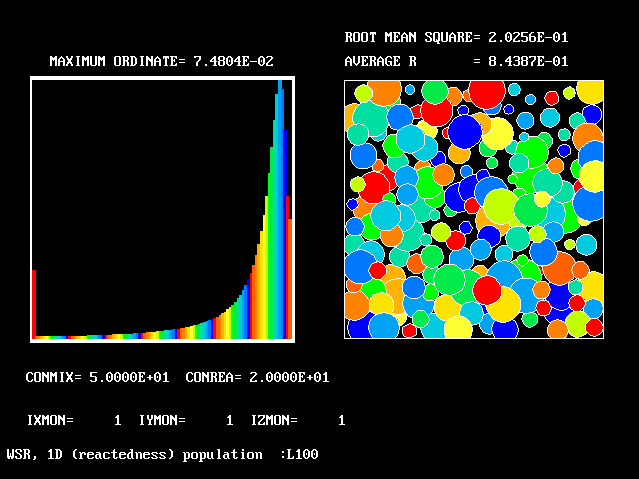 With increased reaction constant, the PDF is even more unsymmetrical
The necessary number of fluids may then become large; however, it is possible to determine the necessary number by grid-refinement studies.
Four results will be shown, for a well-stirred reactor in which the two entering streams are a fully-unreacted lean-mixture gas and a fully-reacted rich-mixture gas.
The population grids will be: 3 by 3 (too coarse) ; 5 by 5 (still too coarse) ; 7 by 7 (fairly good) ; 11 by 11 (more than fine enough). Inspection of the average reactedness reveals the solution quality.
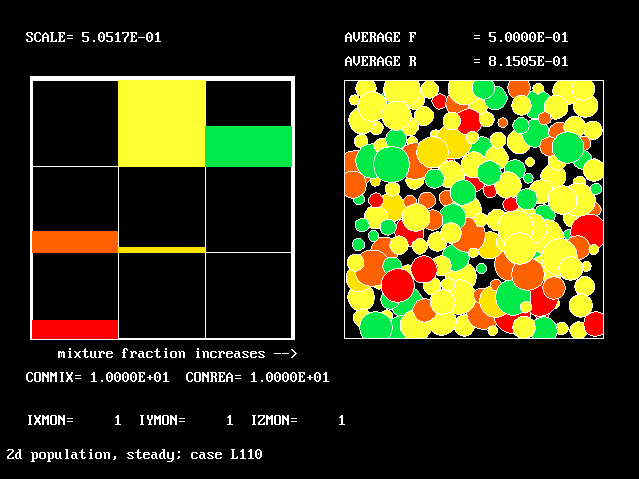 The 3 by 3 grid. Note the value of average R (ie reactedness)
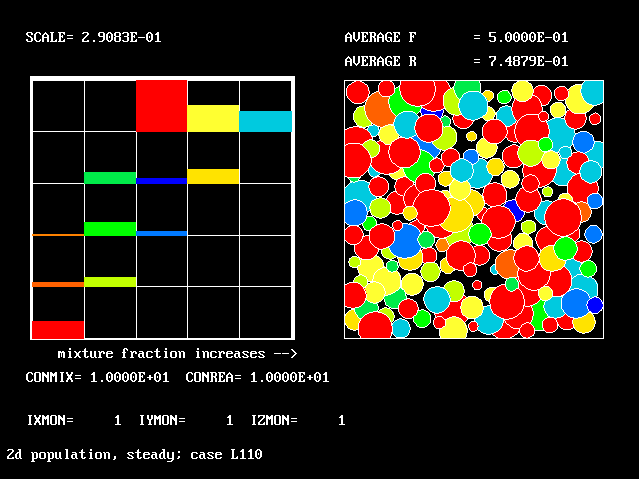 The 5 by 5 grid. Average R is much smaller
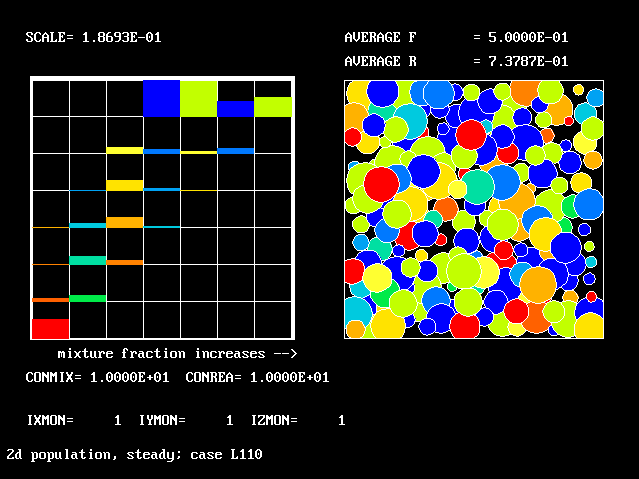 The 7 by 7 grid. Average R is a little smaller
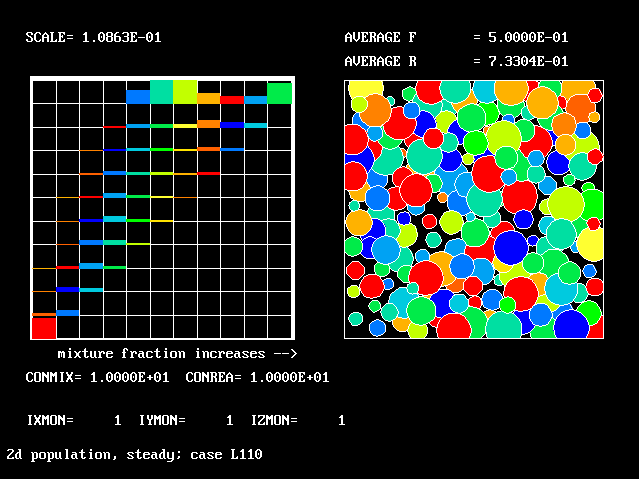 The 11 by 11 grid. Average R is almost the same.
The shapes of the PDFs for the pre-mixed case vary with the values of the mixing and reaction constants (and of other parameters too, of which time-shortage precludes mention). They are "clipped-Gaussian" or "beta-function" only by (rare) chance.
The use of the 2D population for the non-pre-mixed reactor goes beyond what any "presumed-PDF" practitioner has ever dared (or should dare) to presume. Once again, the population distribution varies greatly with the defining parameters.
Such calculations take very little time; but pondering their significance needs much more. More "ponderers" are needed.
The cases shown are standard items of the PHOENICS input library; so any interested researcher can access and exercise them.