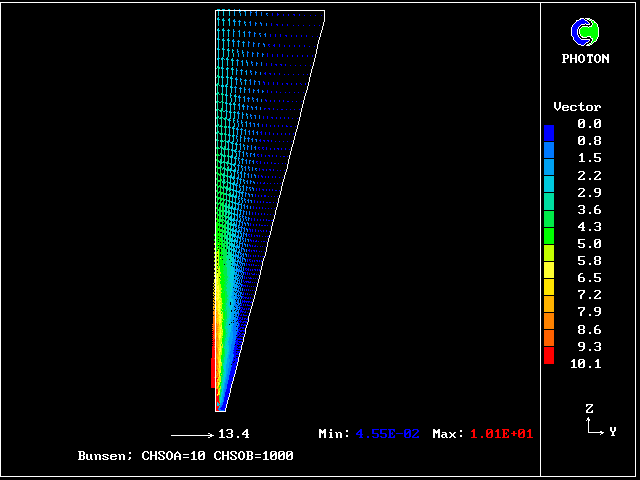
 velocity vectors
The four-fluid model increased the number of fluids by selecting an increasing number of fluid-defining values of a single attribute, namely the reactedness. It exemplified a one-dimensional fluid population.
However, multi-dimensional populations of fluids are generated when more than one attribute is used for fluid definition. This will now be illustrated, by way of the simplest example, namely a two- dimensional population. Once again, an example relevant to combustion will be chosen; specifically, values of fuel/oxidant ratio will be selected, as well as those of reactedness, so as characterise the population.
The following diagrammatic representation is copied from [40], where some of the main concepts of multi-fluid turbulence modelling are explained at greater length than has been possible here.
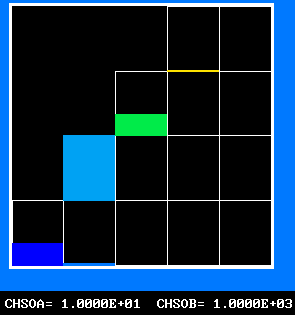
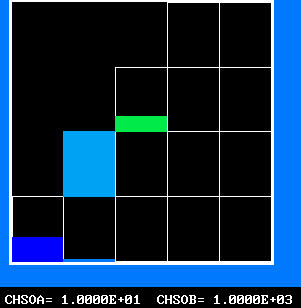
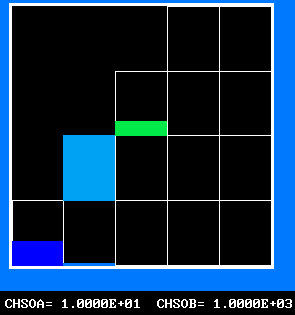
The 4-by-5 fluid-attribute grid, of which the ordinate can be regarded as reactedness and the abscissa as fuel-air ratio, represents a two-dimensional population.
     Fig.6 The 20-fluid population, of which only 14 fluids can exist
       _________________________________________
       |///////|///////|///////|       |       |
f - mfu|///////|///////|///////|  16   |  20   |  * mfu stands for
  ^    | inaccessible  |_______|_______|_______|    mass fraction
  |    | fluid states  |       |       |       |    of unburned
  |    |///////|///////|  11   |  15   |  19   |    fuel;
  |    |_______|_______|_______|_______|_______|  * fluid 1 is
  |    |///////|       |       |       |       |    fuel-free air;
       |///////|   6   |  10   |  14   |  18   |  * fluids 13-16
       |_______|_______|_______|_______|_______|    are stoichio-
       |       |       |       |       |       |    metric;
       |  1    |  5    |  9    |  13   |  17   |  * fluid 17 is the
       |_______|_______|_______|_______|_______|    fuel-rich entry
               --------> mixture fraction, f        stream.

************************************************************
Fluids 6, 11, 16 and 20 are supposed to contain no unburned fuel;
they thus represent completely-burned gases, of various fuel-air
ratios, which can react no further.
Fluids 5, 9, 13, 14, 17 and 18 contain finite amounts of free fuel; but they are regarded as being too cold to burn, like fluid B above.
Fluids 10, 15 and 19 both contain fuel and are hot enough to burn; it is therefore they which, like fluid C in the four-fluid model, carry out the chemical-reaction process.
Fluid 10 thus becomes transformed into 11, fluid 15 into 16, and fluid 19 into 20.
For example, fluid 5 can mix with fluid 19 so as to produce fluids 9, 10, 14 and 15, in proportions which the modeller is free to decide, on the basis of considerations which it would be distracting to discuss here.
A small stream of fluid 16 (stoichiometric combustion products) is supplied at the edge of the burner tube, to act as a lame holder.
  ************************************************************
    Fig. 7 Diagrammatic representation of the Bunsen-burner flame

   . /////////
   |  //flame/                | * PHOENICS is used to solve the
   .  ///////                 |   differential equations for 14
   |   /////     air at       |   fluid concentrations, as well as
   .   ////      rest,        |   for two velocities and pressure;
   |   ///       entrained    |
   /   ///       into         | * The parabolic (ie marching-
   |/  //        flame        |   integration) mode is used.
   .// //                     |
   | ////                     | * The Prandtl mixing-length model is
   .  //                      |   used for the hydrodynamics, and to
   ^^^^^| /                   |   supply local coupling-and-splitting
burner: |  / ignition         |   rates.
fuel-rich    source           |
gas jet |                     | * The grid is 20 (horizontal) and
                                  100 (vertical)

  ************************************************************
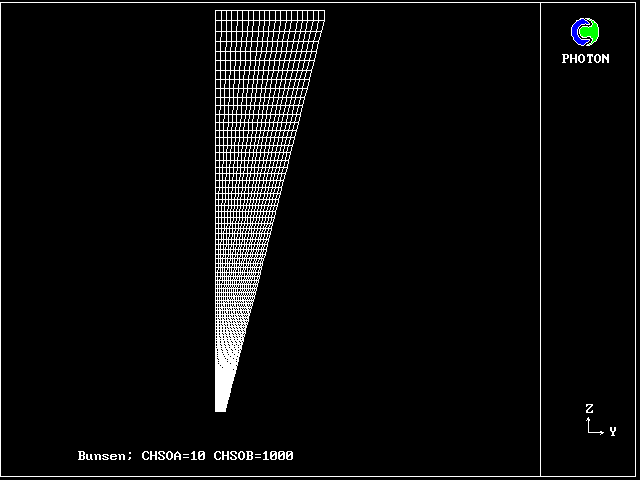 The grid; the parabolic mode
of integration is used
The grid; the parabolic mode
of integration is used
The Prandtl mixing- length model is used for the hydrodynamics.
velocity vectors
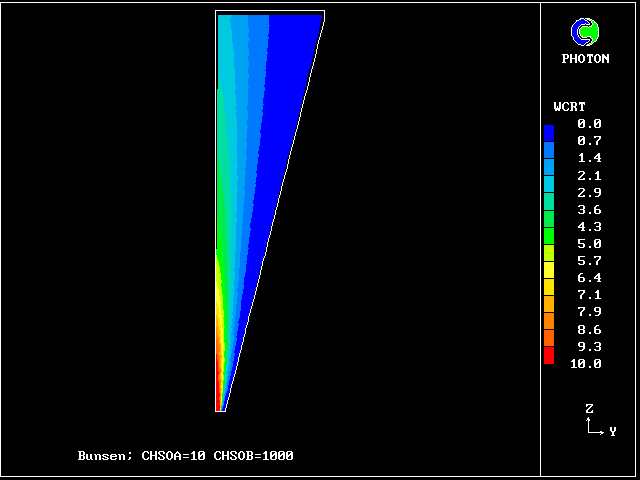 axial velocity
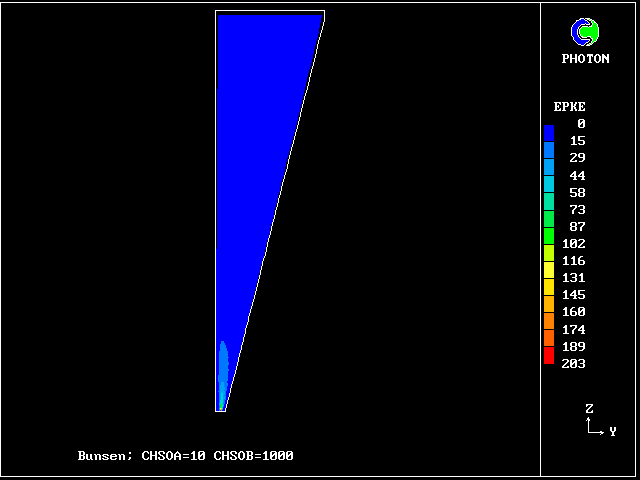 micro-mixing rate (epke)
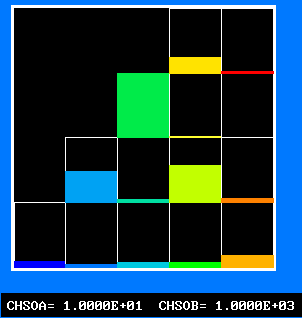
 the 4 fuel-rich gases: f17 contours: unreacted
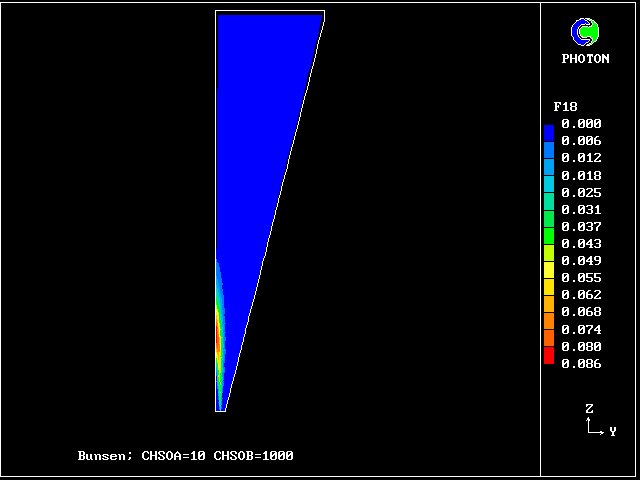 f18 contours: partly reacted
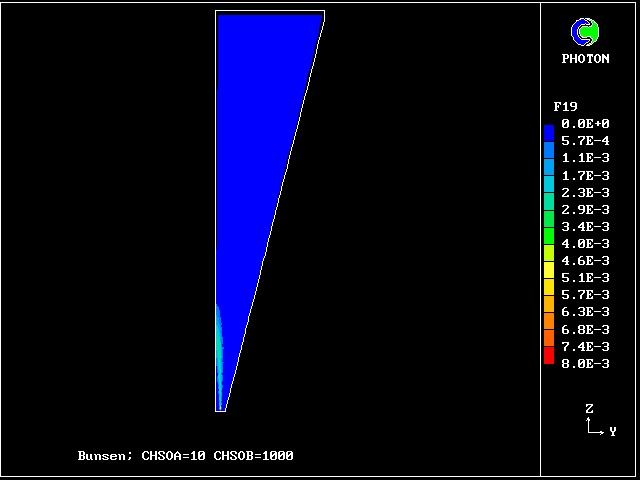 f19 contours: reacting
 f20 contours: fully reacted
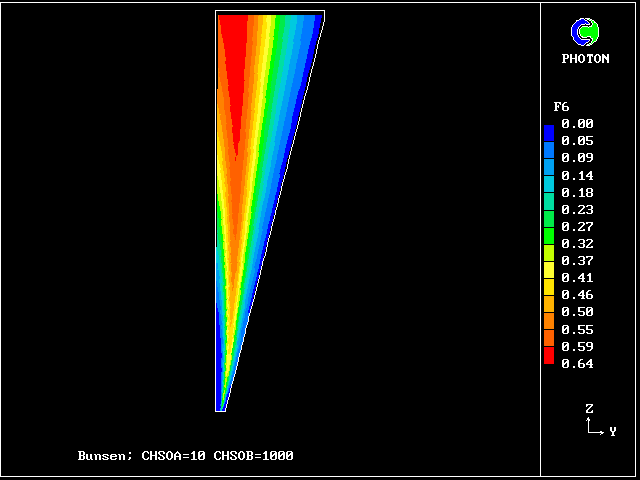
 fully-reacted-gas contours:- the 4 stoichiometric gases
f13 contours: unreacted
fully-reacted-gas contours:- the 4 stoichiometric gases
f13 contours: unreacted
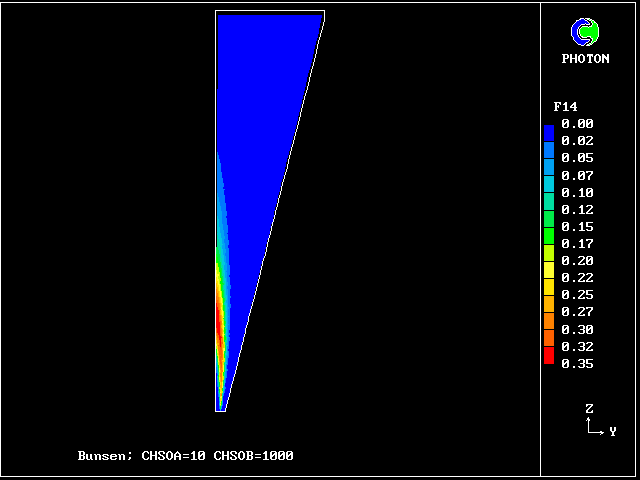 f14 contours: partly reacted
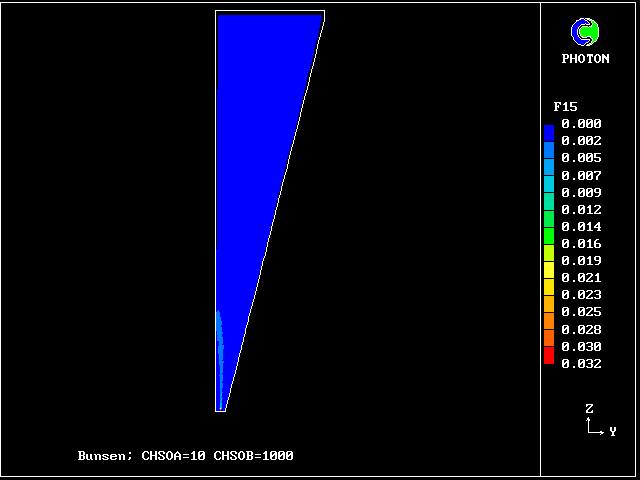 f15 contours: reacting
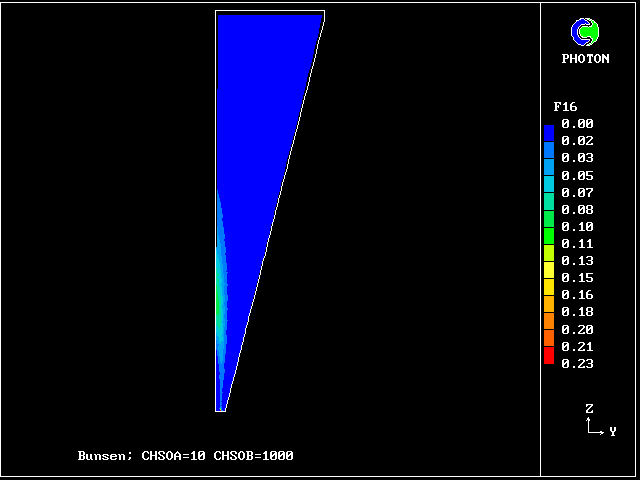 f16 contours: fully reacted
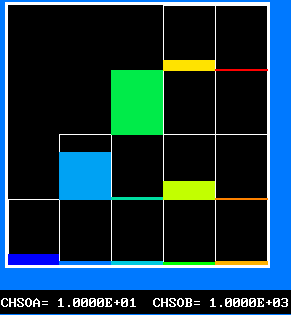
 3 fuel-lean gases:- f9 contours: unreacted
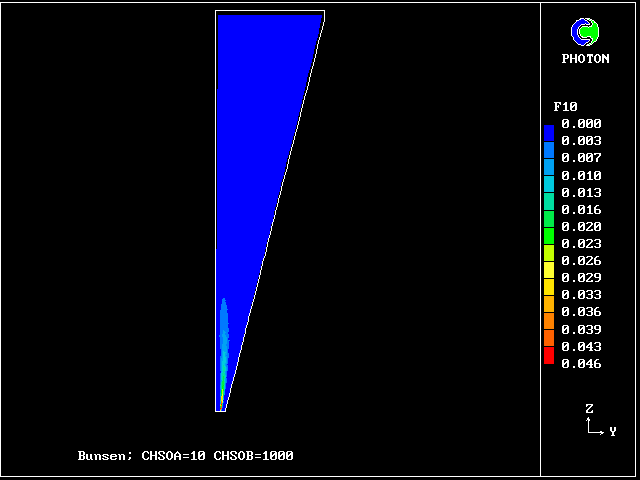 f10 contours:
partly reacted
f10 contours:
partly reacted
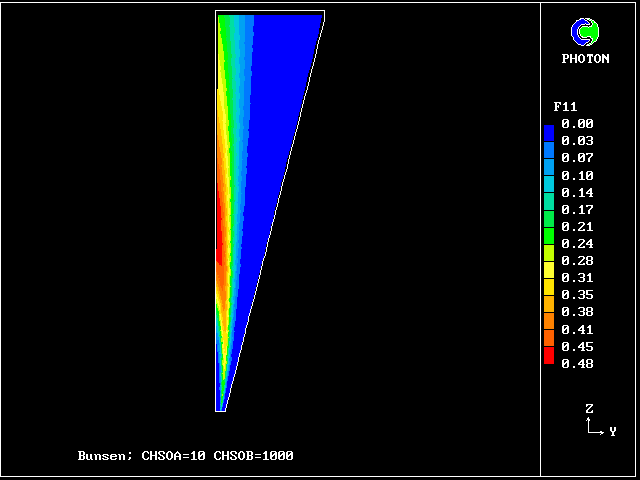 f11 contours: fully reacted
 2 more fuel lean gases:-
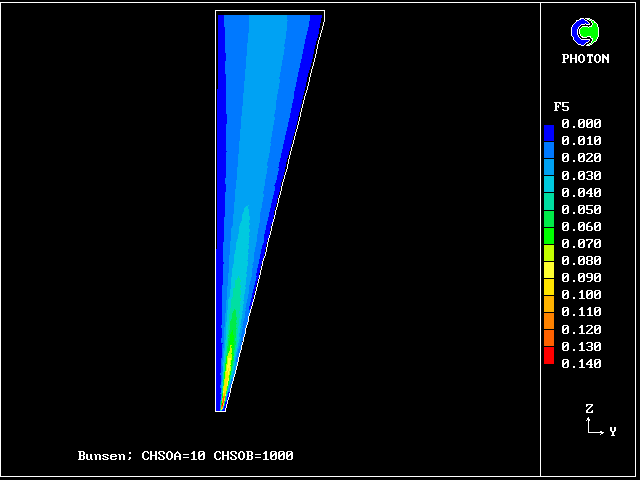
f5 contours: unreacted
2 more fuel lean gases:-
f5 contours: unreacted
 f6 contours: fully reacted
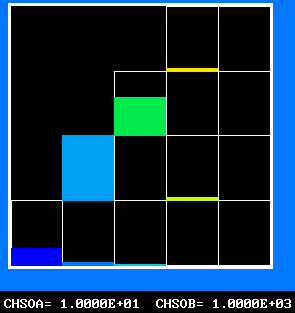
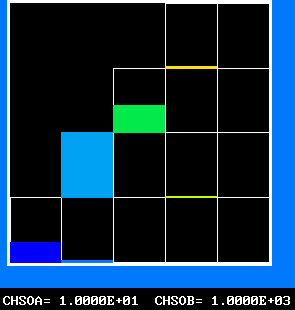
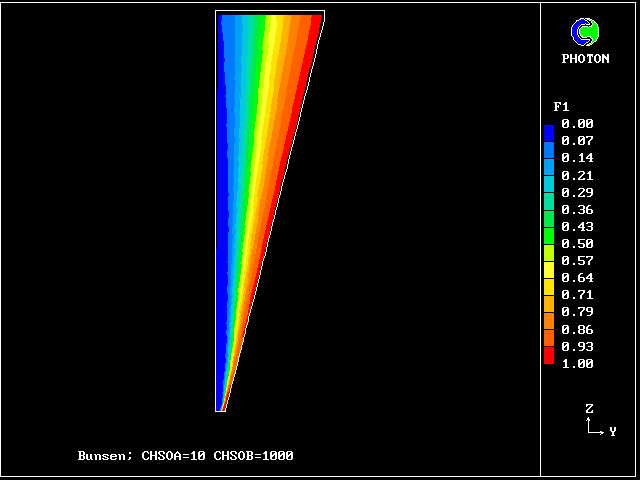 uncontaminated air:- f1 contours:
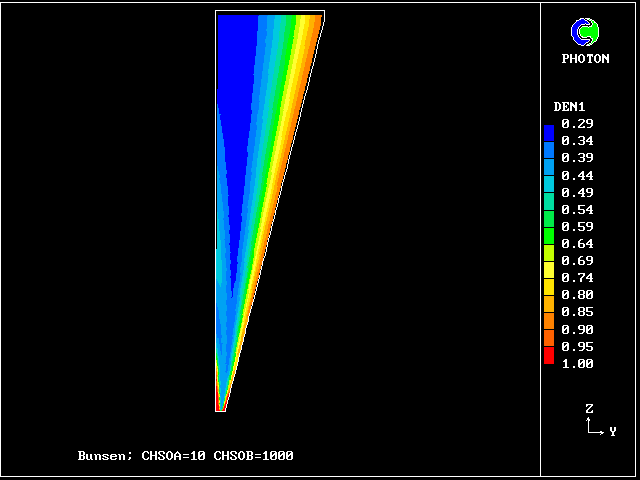 mean gas density
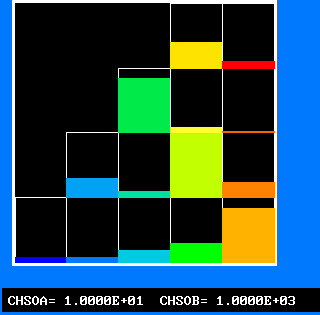
The plots of the concentration profiles of the fourteen distinct fluids are interesting; but it is hard to appreciate all their implications. Therefore another mode of representation has been devised by the author's colleague Liao Gan-Li.
This shows the fluid population distributions directly, both as a conventional histogram and as a randomly distributed set of blobs. The following command lines create screen displays, when this file is viewed through polis. Otherwise the line-printer plots below may be inspected.
Colour pictures constitute a small selection of what can be deduced from the PHOENICS calculation.
The FDP for the location shown by IY (horizontal) and IZ (vertical)
 FPD 1
FPD 1
 FPD 2
FPD 2
 FPD 3
FPD 3
 FPD 4
FPD 4
 FPD 5
FPD 5
 FPD 6
FPD 6
 FPD 7
FPD 7
 FPD 8
FPD 8
 FPD 9
FPD 9
 FPD 10
The following two line-printer plots, showing the profiles of concentrations of some of the fluids along the axis, provide some insight into how the fluids distribute themselves in the flame.
************************************************************
Fig.8 Axial profiles of the mass fractions of unburned fluids.
      Fluid 17 is fuel-rich supply gas; fluid 1 is air

  VARIABLE    1 = F17    2 = F13    3 = F9     4 = F5     5 = F1
    MINVAL=  6.654E-04  5.363E-13  2.382E-13  1.963E-13  4.988E-13
    MAXVAL=  9.988E-01  2.649E-02  4.516E-03  9.750E-04  2.688E-03

1.00 11111111111111.+....2223334444444..+....+....+55555
     +             111  2  3344433    4444   555555    +
     +               112  3 44   33     555554         +
     +                2113 4 22    33555      4444444  +
Fn's +               2  344   22   5533              444
     +              22 3441    2255   333              +
     +              2344  11   552      333            +
     +             244     1155  22        33333       +
     +           4443     55511    222         333333333
     +         4443 5555555   1111   222222            +
0.00 555555555555555+....+....+..11111111112222222222222
     --------- vertical distance above burner -------->
************************************************************
Fig.9 Axial profiles of the mass fractions of burned fluids
      Fluid 20 is fuel rich; fluid 16 is stoichiometric;
      fluid 10 is fuel-lean; fluid 6 is even leaner

  VARIABLE    1 = F20    2 = F16    3 = F10    4 = F6
    MINVAL=  1.246E-03  2.333E-12  9.055E-16  2.237E-13
    MAXVAL=  5.736E-02  3.175E-01  5.355E-04  1.271E-01

1.00 +....+....+....+....+...3333222222.+....+....+..444
     +                      33  33    2222        444  +
     +                     13  2 13       222  444     +
     +                    13  2   133       44422      +
Fn's +                   1 3 2     133   4444   22222  +
     +                  113 2       113444           222
     +                 113 2         44333             +
     +                113322      444  113333          +
     +               113322    4444     111133333      +
     +            1113332  44444           1111133333333
0.00 44444444444444444444444..+....+....+....+....111111
     --------- vertical distance above burner -------->
 ************************************************************
There are many important industrial flames, both desired as in furnaces and engines, and undesired as in oil-platform explosions, in which the fuel/oxidant ratio varies with position and time.
Means have hitherto been lacking for representing such phenomena in any but a single-fluid manner, with consequent inadequacy of realism.
The Bunsen-burner simulation just presented shows that a two- dimensional multi-fluid models can be created which will allow the fragmentariness of such flames to be taken more properly into account.
It seems certain that, when systematically exploited, this possibility will lead to better understanding and predictive capability.
For example, smoke and NOX production in gas-turbines should become easier to control.