Tecplot 360 is CFD & Numerical Simulation Visualization Software. It combines vital engineering plotting with advanced data visualization in one tool.
With one tool you can:
Tecplot 360's full range of XY, 2-D, and 3-D capabilities, multi-frame workspace, and high-quality output gives you total control to get all the types of plots you want for effective analysis, presentation, and publication.
TECPLOT is written by Tecplot Inc, Bellevue, WA, and runs under Windows on PCs, and on most UNIX workstations.
An output file, TECDATA.DAT, containing two TECPLOT zones for each PHOENICS domain is written. One zone is contains data at the cell centres (adjusted for PARSOL cut cells), and one contains data at the cell corners. The first is better for plotting vectors, the second for plotting contours and iso-surfaces.
Full details on how to use the PHOENICS-TECPLOT interface are given in TR/326, PHOENICS-VR Reference Guide
For more details on TECPLOT, visit the Tecplot.inc site.
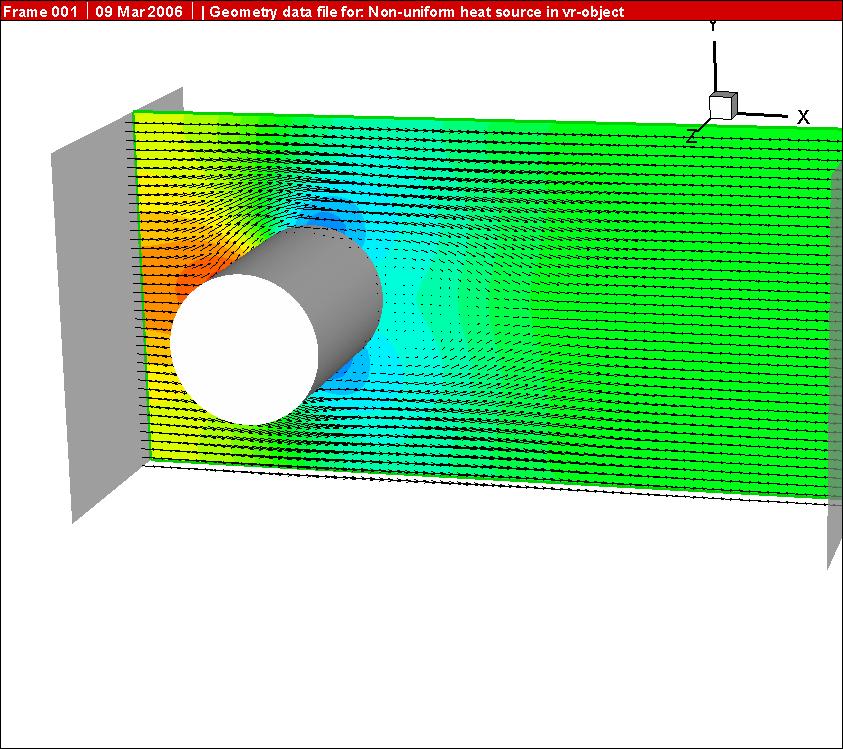
The image below shows the geometry and solution from Library case V146 displayed in TECPLOT 10.