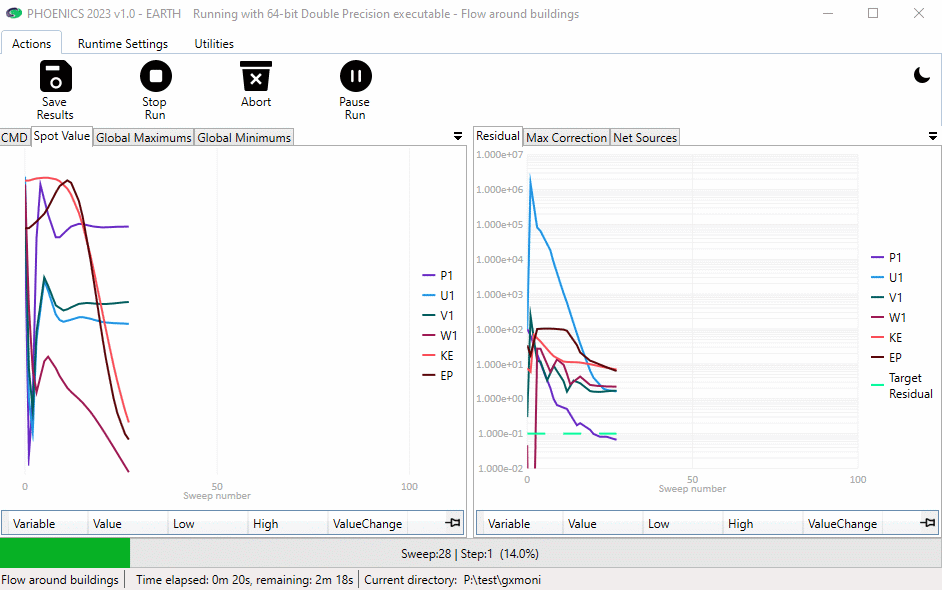
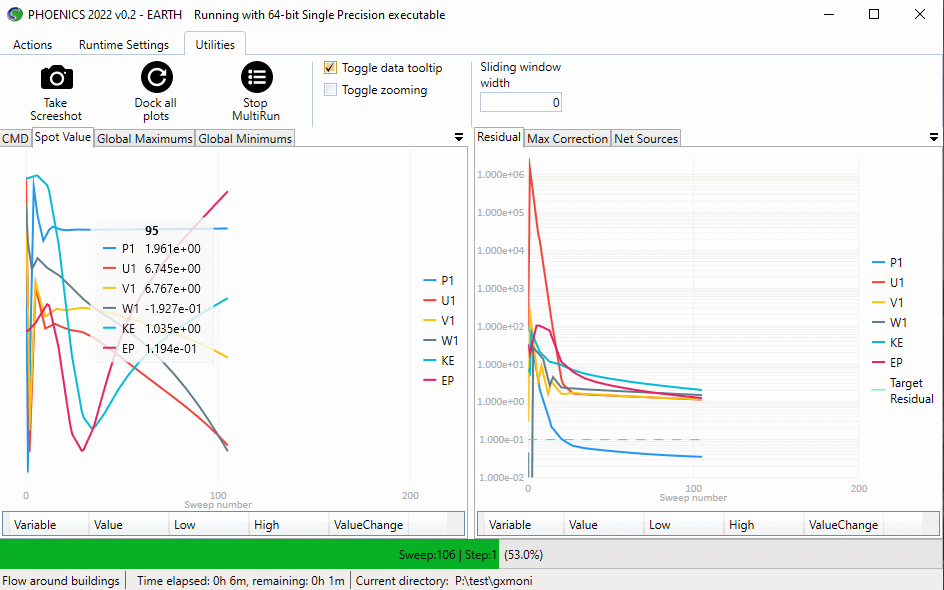
The Earth solver displays convergence monitoring information in a multi-tabbed window.

The tabs display, as a function of sweep:
Each tab can be displayed by clicking it. Alternatively, the tabs can be pulled out to make individual windows. In this way all six plots can be displayed simultaneously.
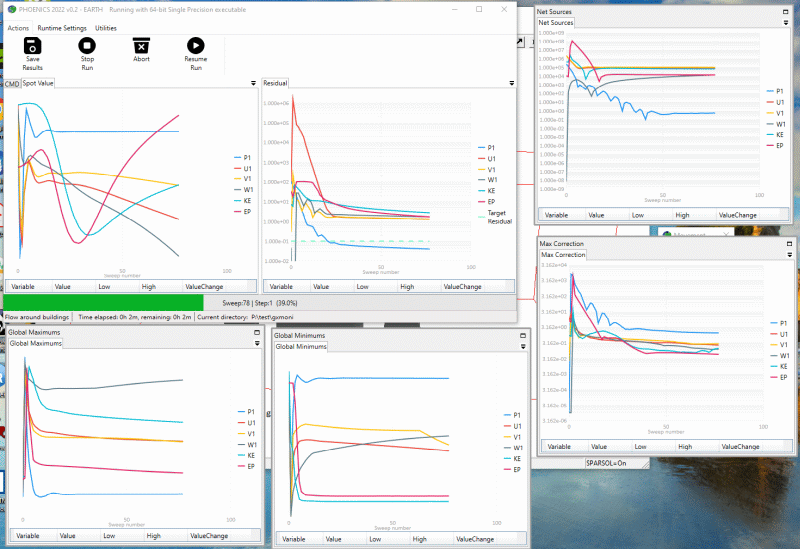
Each separate monitor widow can be moved and resized at will. They can be re-docked individually by dragging them back into the main window:
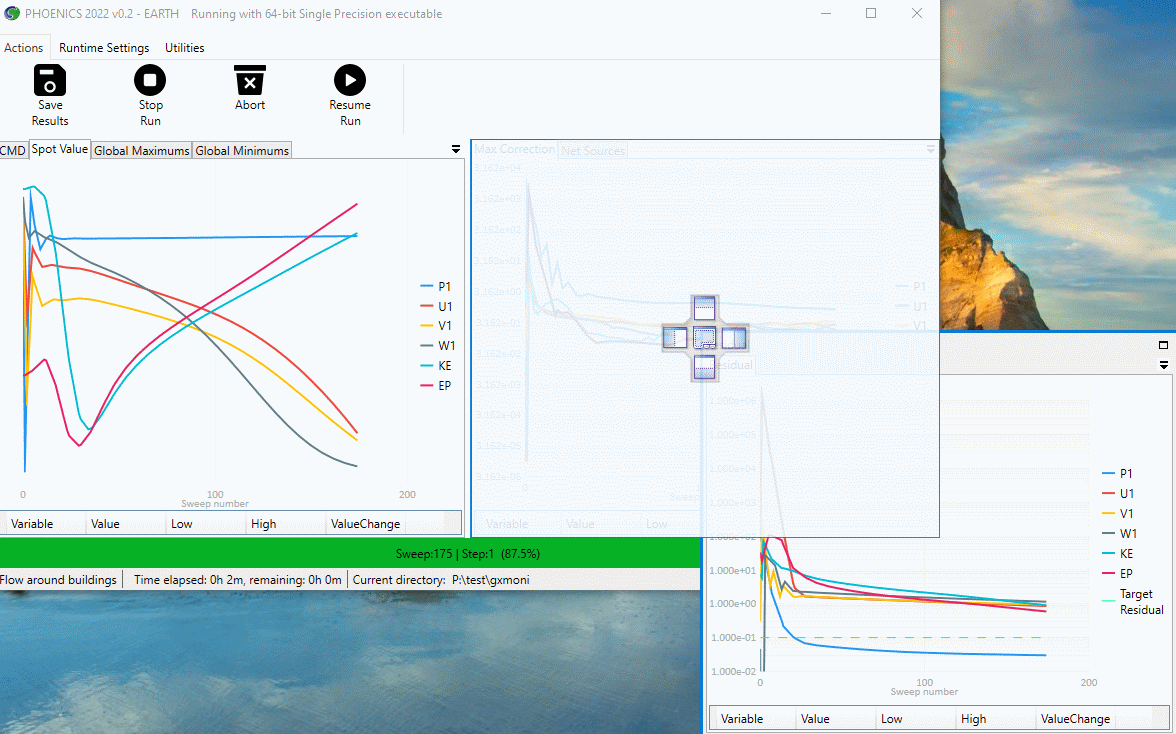
Alternatively, all windows can be re-docked simultaneously by pressing the 'Utilities - Dock all Plots' button.
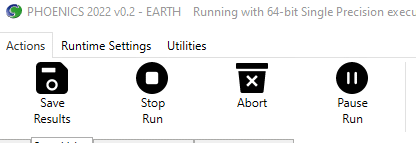
The ribbon along the top of the window contains the following items, each of which has a 'hover' tooltip:
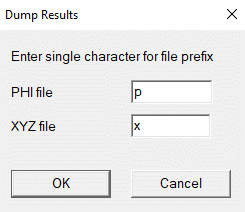
The current sums of net sources are also written to RESULT.
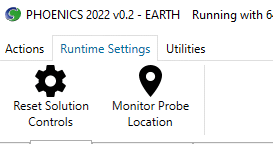
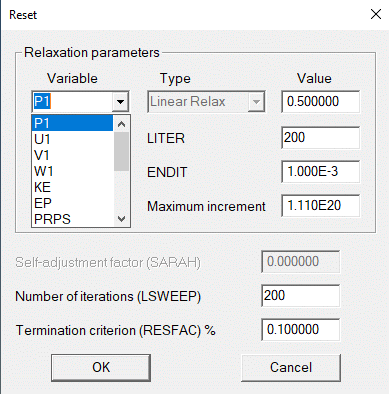
The run remains paused as long as the dialog is displayed. Any changes made are applied when 'OK' is pressed, and the run continues. A note of any changes made is recorded in RESULT.
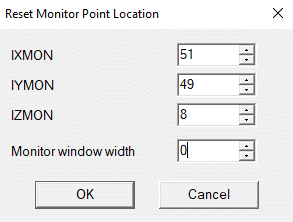
For parallel cases, the cell numbers entered must refer to the original full domain.

Although the new convergence monitor introduces a slightly smaller delay to the solver than the ‘classic’ monitor, it can sometimes struggle to keep up if the screen update time is exceedingly fast. This can happen with very small grids or in transient cases where each step converges in 2-3 sweeps. If this happens, the ‘classic’ monitor may be more advantageous.
The 'classic' solver convergence monitor (the GXMONI screen) can be recovered by adding the line:
SPEDAT(SET, GXMONI, CLASSIC, L, T)
to Group 19 of Q1. If the line is absent, or has 'F' instead of 'T' as the last argument, the new style will be used.
This can also be done from within the VR Editor by selecting 'Classic' on the Options - Monitor options dialog.
Three kinds of monitoring information can be displayed, selected by the setting of ISG50 in Q1 (or in the Editor from Options, Solver Monitor Options or Main Menu, Output, Monitor graph style). The options are:
ISG50 = 0 : display the spot (probe) values on the left, and normalised residuals on the right;
ISG50 = 1 : display maximum value in the field on the left and minimum value on the right; and
ISG50 = 2 : display maximum correction on the left and net sum of sources on the right.
The display can be switched at run-time by interrupting the run and clicking the 'Monitor' box.
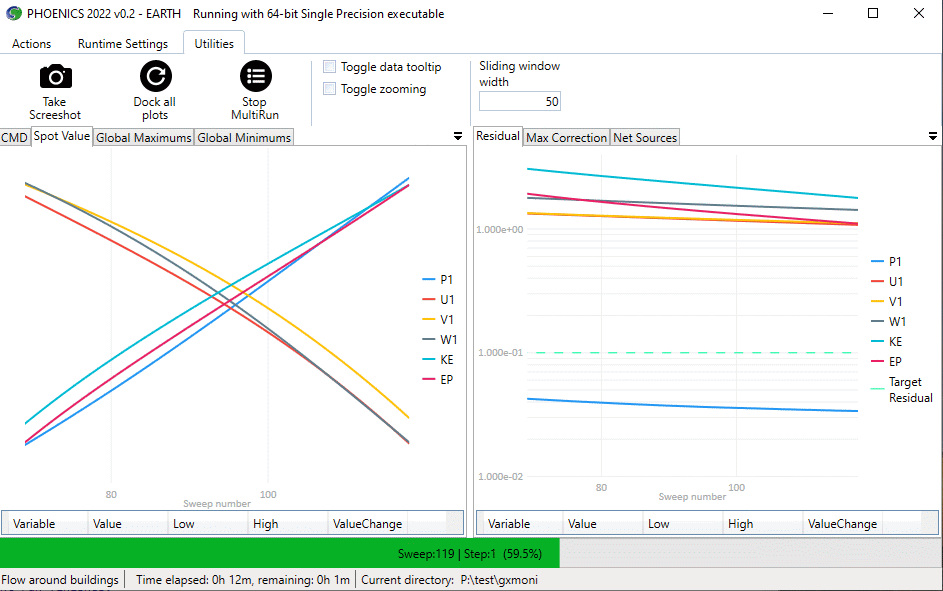
By default, the monitor window will start showing 10 sweeps. At 11 sweeps it will
rescale to show 100, and at 101 it will rescale to show all sweeps. If the
number of sweeps (LSWEEP) is very large, it can be very hard to see the
convergence behaviour especially early in the run. The Q1 setting:
SPEDAT(SET,GXMONI,SWEEPWIDTH,I,nsweep)
will cause the monitor window to show the last N sweeps on a rolling basis. This
can also be switched from Editor, Options, Solver Monitor Options.
At the end of the Earth Solver run a snapshot of the final convergence monitor screen is saved to the file gxmoni, in the current working directory. This allows the convergence behaviour to be seen at a later time. The snapshot is of whateve monitor display is active at the end of the run.
If all three monitor plots are required, the Q1 setting :
SPEDAT(SET,GXMONI,PLOTALL,L,T)
will cause all three images to be saved as gxmoni_spot, gxmoni_mnmx and
gxmoni_mxc. This can also be activated from Editor, Options, Solver Monitor
Options.
If these files are not required, their creation can be inhibited by adding to the Q1 file the
line:
SPEDAT(SET,GXMONI,TRANSIENT,L,F)
The file type for the gxmoni file is set in CHAM.INI in the [Graphics] section as PlotType. The default setting is gif. The alternative settings are jpg, bmp or pcx.