

Document last revised: 15/12/2023
1 The purpose of this document
4 The second example - Adding heat-transfer to the previous example
5 The third example - Changing the computational grid in VR
This document is intended for readers who, having just acquired PHOENICS, wish to perform some simple fluid-flow calculations, before learning knowledge about PHOENICS as a whole.
The activation and use of the following will be described:
This will be done by way of simple examples, illustrated by Fig.1.
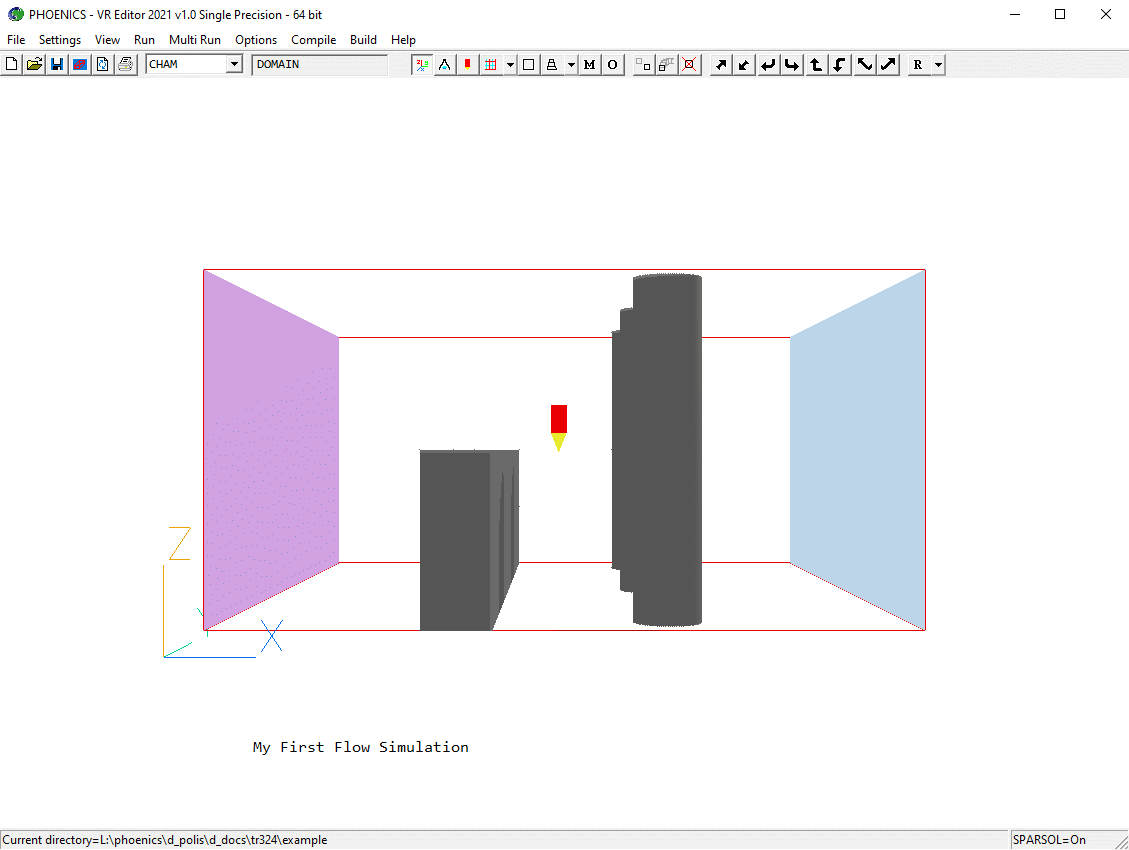
Figure 1: The geometry of the VR flow-simulation example
The remainder of the document is divided as follows:
All this is only a small fraction of what, in the course of time, the PHOENICS users will find it useful to learn.
Thus, the VR Editor is just a simple way of writing the input data file in the powerful PHOENICS input language, PIL. This is the so-called Q1 file. Experienced users often prefer to write those files themselves.
Again, the VR Viewer presents only one way of displaying the results graphically; PHOENICS possesses other graphical display means, for example PHOTON and third party packages such as TECPLOT and PARAVIEW. Many users need to understand and control the numerical output contained in the RESULT file.
Finally, the VR Editor, and its associated menu, can activate only a subset of the PHOENICS flow-modeling capabilities. Many more can be activated by way of:
How to learn about these is explained in TR001, the PHOENICS overview.
The Environment module appears somewhat different according to whether the operating system is:
For Windows, and also Linux under WINE the Environment module can be activated by:
For native LINUX, the Environment can be activated by entering the command pc in a working window, followed by pressing the RETURN key.
From here onward, discussion will be confined to the Windows / Linux under WINE situation. For the others, the appearances on the screen will be, though different, sufficiently similar for the current document to be informative.
Fig.2 shows what appears when the Environment is activated for the first time.
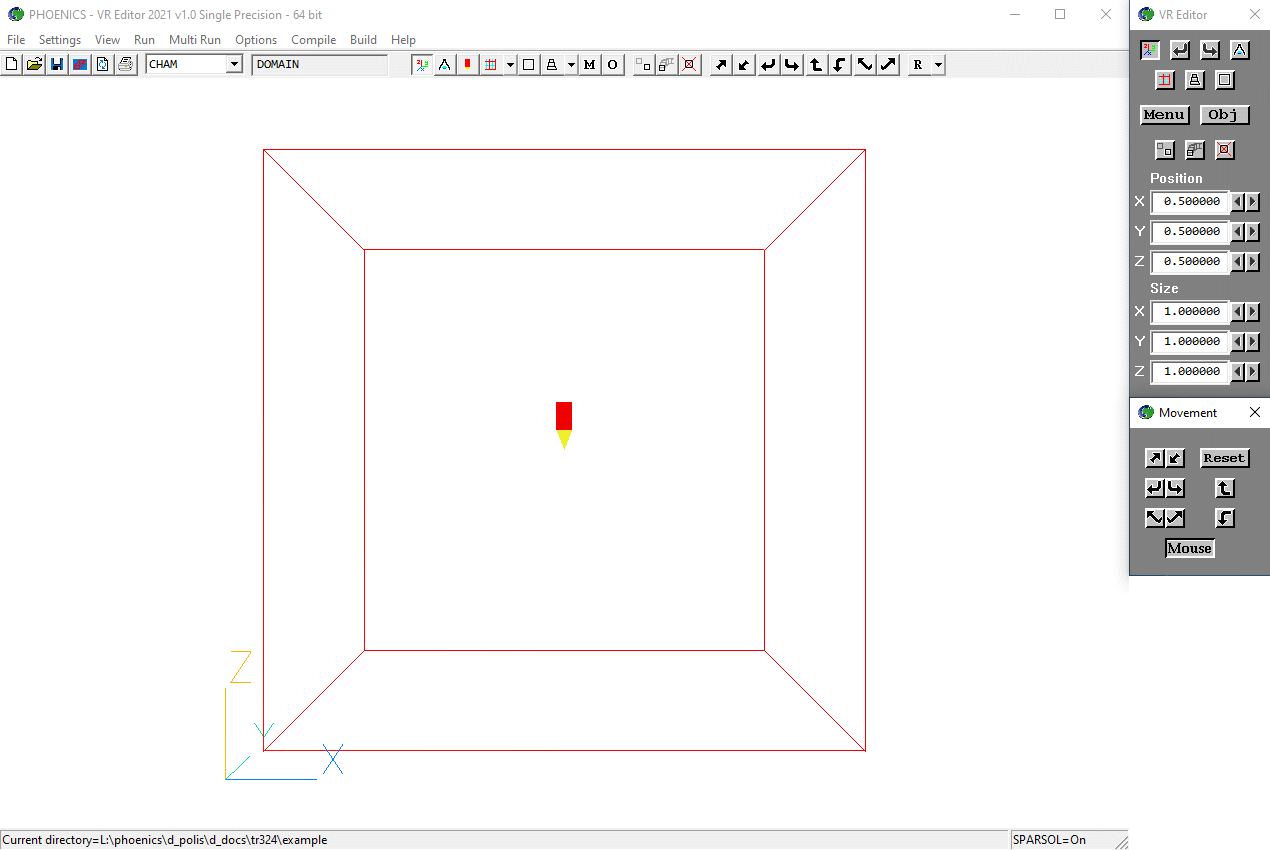
Figure 2: The PHOENICS-VR Environment screen
On subsequent activations, the screen will show the model that was being worked on previously.
That 'PHOENICS VR-Editor' appears on the top line is an indication that, for Windows/Intel-Fortran PHOENICS, there is little distinction between the Environment and the Editor.
Start the VR-Editor as described above. The VR screen shown in Fig. 2 should appear. To ensure that you start with an empty input file, click on the 'File' button, with the result illustrated by Fig.2a.
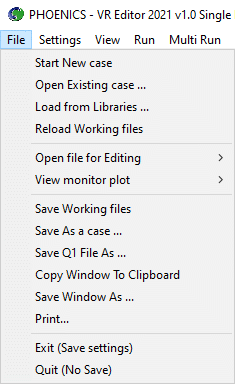
Figure 2a: The PHOENICS-VR environment File menu
Select 'Start New Case', followed by 'Core' and 'OK'. The screen should now look as in Figure 2 above.
The Editor is used for:
What appears on the screen in a VR-Editor session can be determined (in part) by means of the hand set shown in Fig. 3a, a description now follows.
The control features of the VR Editor hand set are now briefly discussed. The hand-set is divided into two separate parts - the movement controls and the domain and object controls.
Movement Controls
Four pairs of arrow buttons allow the user to rotate and translate the model domain contained in the graphics window and to zoom the graphics screen in and out.
There are other viewing controls located in the top two rows of the Object and Domain handset, which allow the user to change various other viewing options, such as hiding objects or controlling the view of the current mesh, etc.
All of the viewing controls are summarised in figure 3a. Some viewing controls have two functions, depending on which mouse-button is used to pick them. In the figure, the function activated by the left mouse button is listed before the slash, and the function activated by the right mouse button is listed after the slash.
Figure 3a: Movement controls of the VR Editor Hand Set.
When the Mouse Control button is pressed (it is active by default), the mouse can be used to dynamically rotate the screen image. The mouse functions are listed in the table below:
| Mouse button held down | Mouse movement | Effect | Equivalent key |
| Left | Left | View left | left-click on |
| Right | View right | left-click on |
|
| Up | View up | left-click on |
|
| Down | View down | left-click on |
|
| Right | Left | Tilt right | left-click on |
| Right | Tilt left | left-click on |
|
| Up | Zoom out | left-click on |
|
| Down | Zoom in | left-click on |
|
| Middle (or both) | Left | Move left | right-click on |
| Right | Move right | right-click on |
|
| Up | Move down | right-click on |
|
| Down | Move up | right-click on |
|
| Shift+Left | Left | Rotate image right about viewer | None |
| Right | Rotate image left about viewer | None | |
| Up | Rotate image down about viewer | None | |
| Down | Rotate image up about viewer | None | |
| Shift+right | Left | None | None |
| Right | None | None | |
| Up | Move back | right-click on |
|
| Down | Move forward | right-click on |
If the movement control panel is closed, the mouse is automatically activated.
To quickly zoom in on a portion of the screen, hold the Ctrl key down and move the mouse sideways with the left button held down. A red box will follow the motion of the cursor. When the mouse button is released, the image with the red box will be drawn full-screen. This operation can be undone by pressing Ctrl+z,or backspace.
Main Controls
The control buttons located in the larger handset are referred to as the Main Controls. These are summarised in Figure 3b. Two of the most important controls located in this panel are the 'Main Menu' and 'Object' buttons.
The other control buttons located below the Object button can be used to delete objects, duplicate objects and create arrays of objects, as shown in Figure 3b. All of these main controls will be used in the flow simulation in next section.
Figure 3b: Main controls of the VR Editor hand set.
Users are encouraged to investigate the functions of the various buttons that have been described this far for themselves, before attempting the following flow simulation.
If desired, both control panels can be closed to allow an unobstructed view of the maximised graphics screen. The icons appearing on the control panels can be displayed on the tool bar by clicking on 'View ' - 'Toolbars' - 'All'.
The quantities to be solved for are pressure and velocity. It will be necessary to specify a flow inlet, and a flow outlet. In addition, two objects referred to as 'fence' and 'cylinder' will be used as blockages.
a. Use the PHOENICS-VR environment screen to create a new file as described above.
To make the required global settings to describe the flow domain fully:
click on the 'Main Menu' button
(or
on the toolbar). The top page of the Main menu, as shown in Figure 4, will appear on the screen. The menu date may differ from that shown.
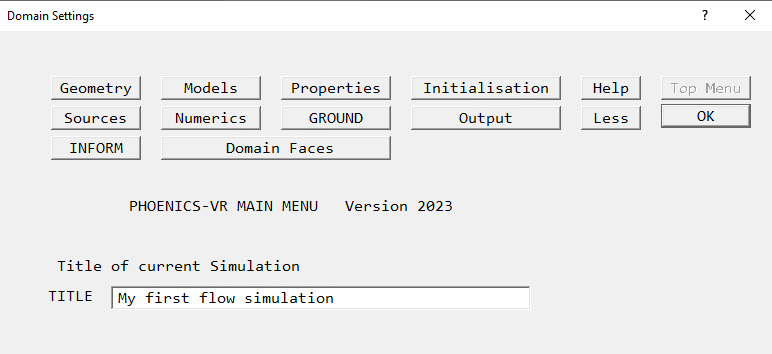
Figure 4: The Main Menu top page.
To set the title for this simulation, click on the 'Title' dialog box. Then type in a suitable title, for example 'My first flow simulation'.
To set the size of the Flow Domain, click on 'Geometry' and change the Domain Size in the Z-direction to 0.5 m, see figure 5.
Figure 5: The 'Geometry' page of the Main Menu.Automatic meshing is switched on by default, this is indicated by the buttons 'X-Auto', 'Y-Auto' and 'Z-Auto' in figure 5 above. Each direction may be toggled to 'Manual' by clicking on these buttons.
The Auto setting will usually generate a grid that is adequate for the first calculations, but may require refinement for the final 'production' calculations. Refining the mesh will be covered in Example 3. Click 'OK' to close the Grid Mesh Settings dialog.
To select which physical processes will be simulated, click on 'Models' to obtain the menu page shown in figure 6.
Figure 6: The 'Models' page of the Main Menu.Check the 'Solution for velocities and pressure' button, ensuring that it is set 'ON'.
To set the turbulence model:
Click on the 'Turbulence models' button to bring up a list of available turbulence models as in figure 7.
Select the 'LVEL' Turbulence model from it.
Click on 'OK'.
Click on 'Top menu'.
Click on 'OK'.
Figure 7: The 'Turbulence Models' page of the Main Menu.
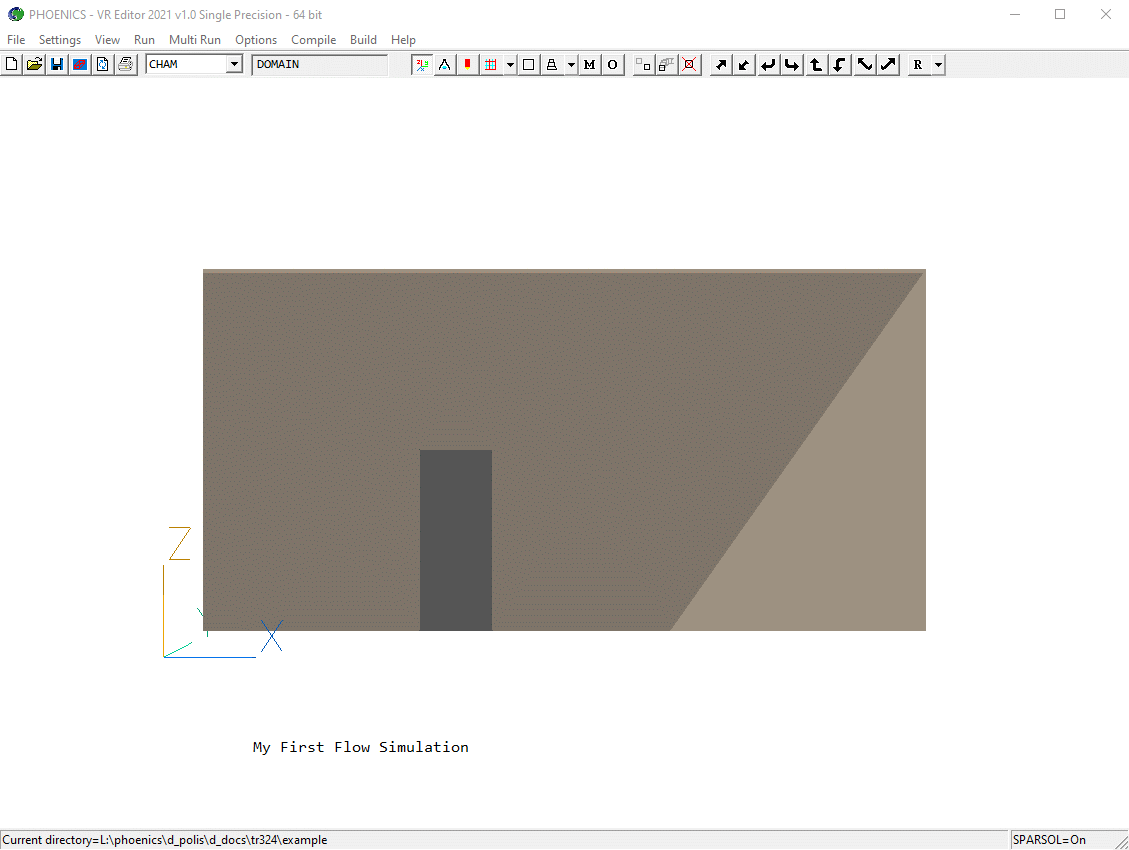
Now the user should have returned to the main VR Editor screen, and the graphics screen should look like figure 8. (If the image does not appear correct, click on the pull-down arrow next to the 'R' icon on the toolbar; then 'Fit to window'.)
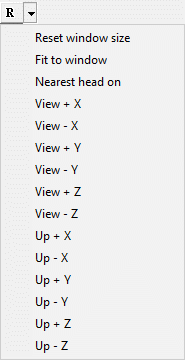
Figure 8: The domain with its size set.
b) Next, create the first object, which will act as a blockage in the flow domain.
To create a fence across the flow domain in the y-direction:
Click on the
button on the Control panel (or
on the toolbar), this will open the Object management panel (OMP). From the Object menu choose the option New -> 'New object ->Blockage'. A new blockage object will then be created at the origin of the domain and the object dialog will be opened. This will display the dialog box shown in figure 9.
Figure 9: The Object dialog Box.Change name to 'FENCE'.
Go to the dialog page titled 'Size', set the size of object as:
X: 0.1
Y: tick 'To end'
Z: 0.25Now go to the dialog page titled 'Place', set the position of object as:
X: 0.3
Y: 0.0
Z: 0.0Return now to the 'General' dialog page
To set the material properties for the fence, click on 'ATTRIBUTES', click on 'Other Materials', then on 'SOLIDS', then 'OK', followed by 'ALUMINIUM' and 'OK'.
Click on 'OK' to return to the Object dialog Box, and then on 'OK' to close the Object dialog Box. The VR Editor screen should appear as in figure 10.
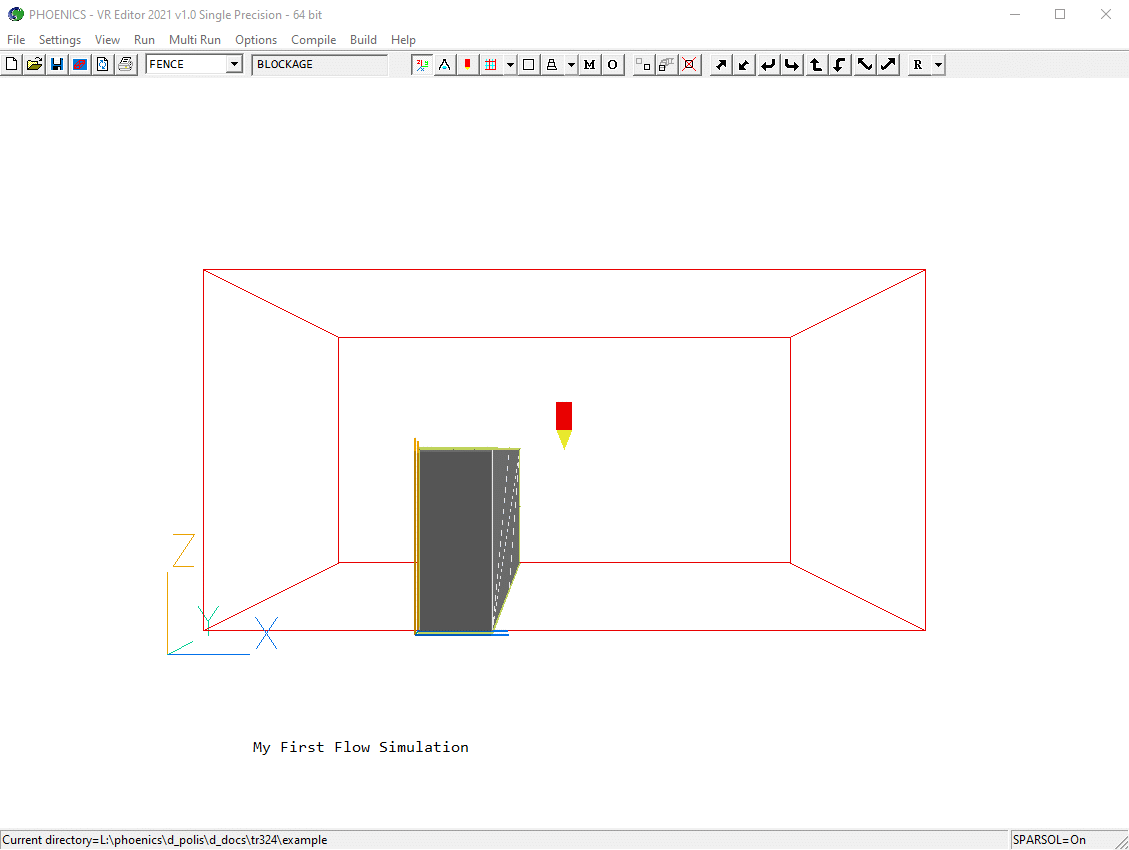
Figure 10: The fence object.
c) Now create another object, which will serve as an additional blockage in the flow domain.
To create a blockage in the form of a cylinder, do the following:
From OMP choose the menu item 'New -> New object ->Blockage'.
Change name to 'CYL'.
Go to the dialog page titled 'Size', set the size of object as:
X: 0.1
Y: 0.1
Z: tick 'To end'Now go to the dialog page titled 'Place', set the position of object as:
X: 0.0
Y: 0.0
Z: 0.0Next, Go to the dialog page titled 'Shape'
In 'Geometry', select PUBLIC\BASIC_SHAPES\CYLINDER.JPG, and click 'OK' on the Geometry Import dialog which opens.
Return now to the 'General' dialog page
To set the material properties for the cylinder:
Click on 'ATTRIBUTES', 'Other materials', 'OK', 'SOLIDS', 'OK' followed by 'ALUMINIUM' and 'OK'.
Click on 'OK' to return to the Object dialog Box, and then on 'OK' to close the Object dialog Box. The VR Editor screen should appear as in figure 11.
Figure 11: The fence and cylinder objects.
d. Next, an array of cylinders will be created from the first cylinder.
First, the cylinder just created will be used to make two more cylinders for a total of three. To accomplish this:
The cylinder should already be the current object - it should be outlined in white and highlighted in the OMP. If it is not, click on it in the VR Editor graphics window or the OMP. The outline of the cylinder facets will turn white indicating that it has been 'selected' for further editing.
Click on the 'Duplicate using array' button
on the hand-set (see figure 3b) or window tool bar and set DIMENSION and PITCH as:
Direction Dimension Pitch X 1 0.0 Y 3 0.4 Z 1 0.0 DIMENSION is the number of repetitions in a direction. PITCH is the distance between origins. The OFFSETs allow for diagonal propagation, and can be left at 0.0. Click on 'OK'. Three cylinders should now appear in place of the original cylinder in the graphics window, as shown in figure 12.
Figure 12: The three cylinder objects.
Now the three cylinders will be grouped so they can be moved together:
At this point the final object in the array, CYL_4, should now be highlighted in the Object management panel. To create the group highlight the objects from CYL through to CYL_4. This is done through familiar windows techniques; while CYL_4 is highlighted, hold the shift key down then click on the line containing CYL. This should then highlight all the lines and hence objects between these two objects. The current group consists of the highlighted objects. See figure 12a.
Figure 12a: The three cylinder objects grouped.The group may be move to a specified location by entering a new position on the control panel (see figure 3b). Set the X position to 0.60 and Y position to 0.04. The geometry should now look as in figure 13.
Figure 13: The array of cylinders moved to new position.
e) Next, the boundary conditions on the faces of the flow domain will be set.
We will set the following conditions:
To create an inlet on a face of the domain:
From OMP double-click 'Domain', or click the 'Main Menu' button
(or
on the toolbar).
When the Main Menu opens, click 'Domain faces' to open the 'Set Domain Edge Conditions' dialog shown below:
Set the Xmin face to Flow - Yes.
Click 'Settings' on the Xmin line. On the 'Inlet Attributes' dialog which opens, set the velocity in the X-direction to 10 m/s.
To create an outlet from the domain:
Set the Xmax face to Open - Yes
To set wall-boundary conditions on the remaining faces of the domain:
Set the Ymin, Ymax, Zmin and Zmax faces to Wall - Yes
Click OK to close the Domain Edge Conditions dialog.
The final geometry should appear as in figure 1.
The walls are hiding the inside of the domain, so we need to hide them. In the OMP, select all the PLATE object, then right-click on one of them and select 'Hide object(s)'. The geometry should now appear as:

Note the arrow on the inlet object. This is a flow direction indicator. Flow travels along the shaft of the arrow towards the head. In this case it shows that flow is entering the domain from the left as expected.
f) To set the solver parameters:
Click on Main menu, on 'Numerics', then on 'Total number of iterations'.
Set the number of iterations (also called 'sweeps') in this window to 200.
Click on 'Top menu'.
Click on 'OK'.
g) Next, a point in the flow domain should be set where the flow variables can be probed or monitored as the solution runs.
To set the monitor location:
Click on the probe icon
on the toolbar or double-click the probe itself, and move the probe to X=0.5, Y=0.5, Z=0.25
The monitor point is shown as the pencil (probe). It can also be moved interactively with the X/Y/Z position up and down buttons, as long as no object is currently selected.
h) Check the grid
Click on the 'Mesh toggle' button. The default mesh will appear on the screen.
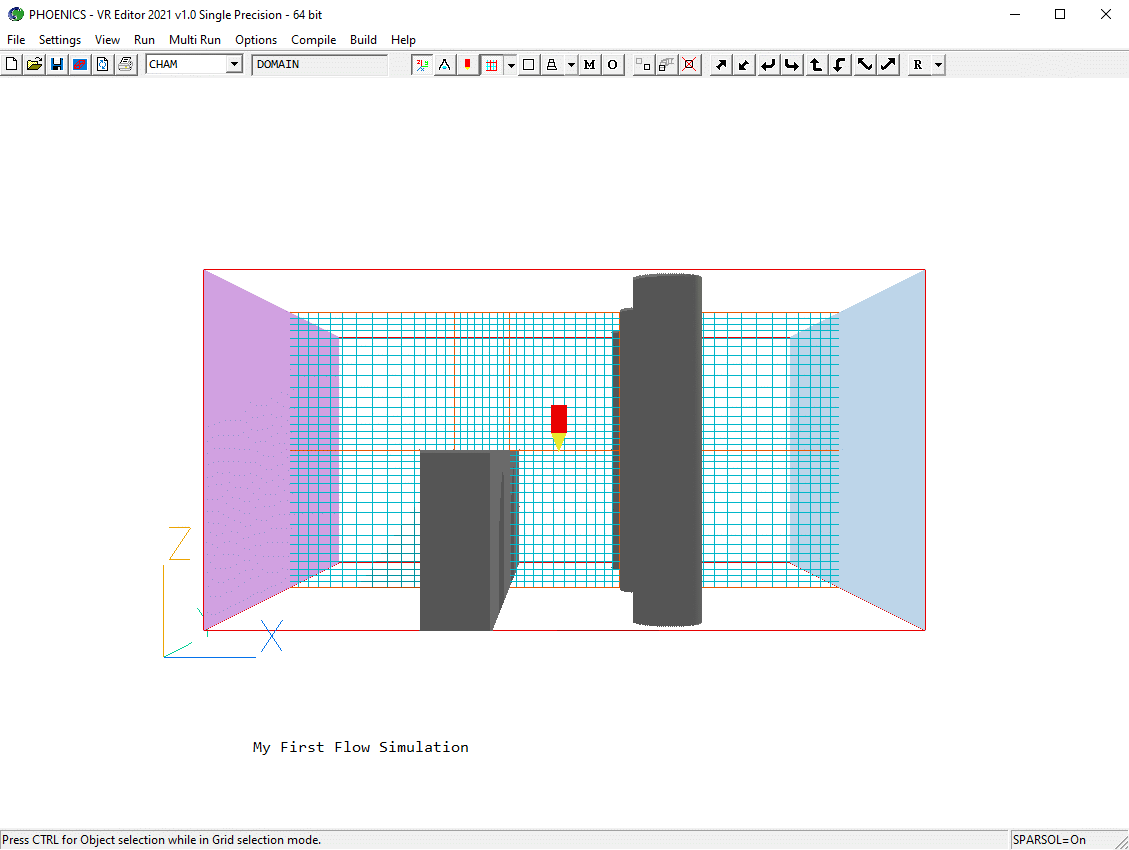
Figure 13a: The default grid
As was mentioned earlier, this mesh is good for the first few runs when trends can be established. It should eventually be refined for a more accurate solution.
The PHOENICS solver is called Earth. To run Earth, click on 'Run', then 'Solver', then click on 'OK' to confirm running Earth. These actions should result in the PHOENICS Earth screen appearing.
As the Earth solver starts and the flow calculations commence, two graphs should appear on the screen. The left-hand graph shows the variation of pressure and velocity at the monitoring point that was set during the model definition. The right-hand graph shows the variation of errors as the solution progresses.
Figure 14 is an example of these graphs from a typical EARTH solution sequence.
Figure 14: An example of an EARTH run screen.
As a converged solution is approached, the values of the variables in the left-hand graph should become constant. With each successive sweep number, the values of the errors shown in the right-hand window should decrease steadily.
Runs can be stopped at any point by following the procedure outlined below.
Please note: If the solver is stopped before the values of the variables in the left-hand graph of the convergence monitor approach a constant value, the solution may not be fully converged, and the resulting flow field parameters which have been calculated may not be reliable.
The results of the flow-simulation can be viewed with the PHOENICS VR post-processor called VR Viewer. This section provides a brief introduction to the capabilities of the VR Viewer.
What the VR Viewer can do.
In the VR Viewer, the results of a flow simulation are displayed graphically. The post-processing capabilities of the VR Viewer that will be used in this example are:
How to access the VR Viewer.
To access the VR Viewer, simply click on the 'Run' button, then on 'Post processor', then 'GUI Post processor (VR Viewer)' in the PHOENICS-VR environment. When the 'File names' dialog appears, click 'OK' to accept the current result files. The screen shown in figure 15 should appear.
Figure 15: The VR Viewer screen for this case with the VR-Viewer hand set on the right hand side.
The VR Viewer screen picture and hand set control buttons.
At first glance, the VR Viewer looks very similar to the VR Editor. There are however differences in the controls and graphics-window annotations that allow the viewing of results in the flow domain, for example:
To the left of the graphics window appears a coloured list of numbers. This is the colour scale, which corresponds to the currently-selected result variable. The colours associated with the numeric values on the scale are those that will be used when plotting flow vectors, contour plots, iso-surfaces and streamlines.
A results probe can be used to query the flow domain for values of any selected result variable that has been solved for with the Earth solver. The single number that appears at the top right of the viewing window indicates the value of the selected results variable at the current probe position. The current probe position is indicated in the graphics window by the red pencil-like probe icon. The probe position can be changed by using the 'probe position' arrows located in the lower portion of the larger handset. These 'probe position' controls work much like the 'position' controls that were used to position objects in our earlier example in the VR Editor section of this document. The probe can also be moved by clicking on the probe icon
on the toolbar or double-clicking the probe itself and using the dialog that appears.
A black rectangle cuts through the flow domain. This rectangle indicates a results-viewing plane that passes through the probe location. If the background colour is dark, the outline of the viewing plane will be white. Flow vectors and results contours can be plotted on this viewing plane. The orientation of this viewing plane can be changed by using the three 'viewing plane control' icons marked X, Y and Z, located toward the centre of the control panel. Once an orientation for the viewing plane has been chosen, the 'Probe position' controls can be used to move the probe and the associated viewing plane through the flow domain.
Vectors, contours and iso-surfaces can be plotted by using the three icons located to the left of the 'viewing plane control icons'. Vectors, contours and iso-surfaces are all coloured by reference to the current variable. The value used for iso-surfaces is the value of the current variable at the probe position. Thus, moving the probe will cause vectors, contours and iso-surfaces to be redrawn appropriately.
Streamlines can be plotted up- or downstream (or in both directions) from the current probe position. Multiple streamlines can be created by started along a line or around a circle.
A brief description of the control buttons of the VR Viewer is shown in figure 16.
Figure 16: The viewing controls of the VR Viewer hand set.
These icons can be made to appear on the toolbar if the Viewer hand-set is closed.
The simple flow simulation just completed can now be viewed by obeying the following instructions:
Start by selecting Y as the viewing plane by clicking on the 'Slice direction Y' button. Now click on the 'Select velocity' button followed by the 'Vector toggle'
. This will display velocity vectors on the current result plane.
Use of the probe Y-position arrow buttons will shift the location of the result plane along the y- axis.
Pressure contours can be viewed by first clicking on the 'Vector toggle' to turn off the vector display mode and then clicking on the 'P' (Select pressure) button to set the current results variable to pressure. Next, click on the 'Contour toggle'
. Contours of pressure are then displayed on the current result plane.
A velocity iso-surface can be obtained by first clicking on the 'Contour toggle' to turn off the plane of contours and then by clicking on the 'V' (Select velocity) button, followed by clicking on the 'Iso-surface toggle'
. This will display a surface of constant velocity known as an velocity iso-surface. The value of the iso-surface will be the velocity, which exists at the current probe position. To obtain iso-surfaces of different velocity values, the position of the probe will need to be adjusted.
Typical displays of a vector, contour and an iso-surface plot are shown below in figures 17 a - c respectively.
Figure 17a: A typical vector plot.
Figure 17b: A typical contour plot.
Figure 17c: A typical iso-surface.
Now experiment further with the rest of the control buttons, so as to learn how to zoom in and out, rotate etc.
To see the velocity distribution on the surface of the middle cylinder (CYL_3), click on it to select it. Right-click to show the context menu, and select 'Surface contour'. Click on the graphics window background to de-select CYL_3. The surface contour should appear as in figure 17d.
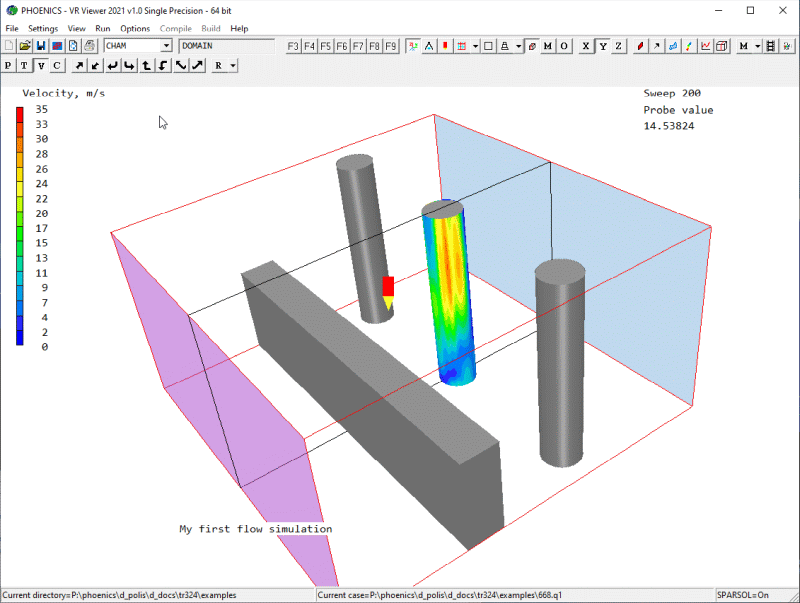
Figure 17d: Surface Contour of Velocity
To display a 'tube' of streamlines, change the
plotting plane to X by clicking on the
'Slice direction X' button. Move the probe nearer to the inlet, around X = 0.095. Click on
the 'Streamline' button  to bring up the
Streamline Management dialog. The first time the Streamline dialog is opened, it will go straight
to the 'Options' dialog. In the section 'Streamline start' click on the radio button 'Around a
circle'. A small circle of spheres will now appear around the probe.
In this image the 'Point size' has been increased to 0.0375 and the 'Circle radius' set to 0.075.
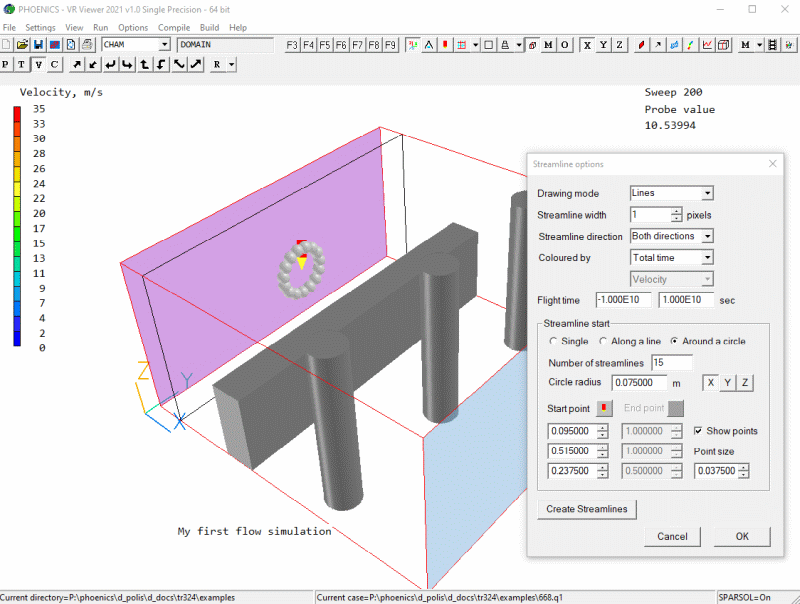
The spheres represent the starting locations for the streamlines. Click on 'Create Streamlines' to generate the streamlines as shown in figure 17e. OK to close the dialog. The Streamline Management dialog will now to allow further control of the streamlines .

Figure 17e: A Circle of Streamlines
To return to the 'Options' dialog at a later time, select 'Object' - 'Options' from the Streamline management Dialog.
The streamlines are managed from the 'Streamline Management' dialog. From there you can select any or all streamlines and hide, reveal or delete them.
To get a graph plot of a variable along a line, click the
'Plot variable profile'
button  on the toolbar. On the dialog
which appears, enter the start and end coordinates of the line. Enter how many points to plot, and
select the variable as shown in fig 17f.
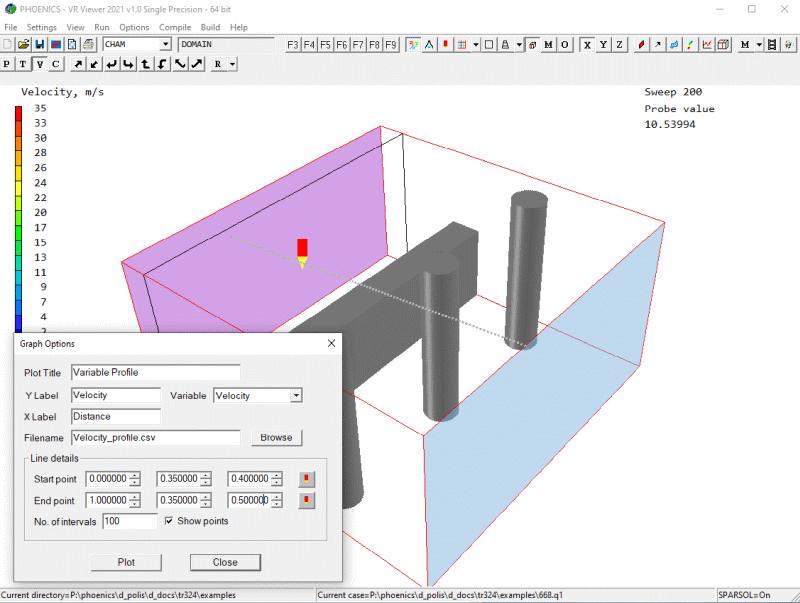
Figure 17f: The 'Graph options' dialog
When all entries are correct, click 'Plot', and the graph of the selected variable along the chosen line will appear, as in fig 17g.
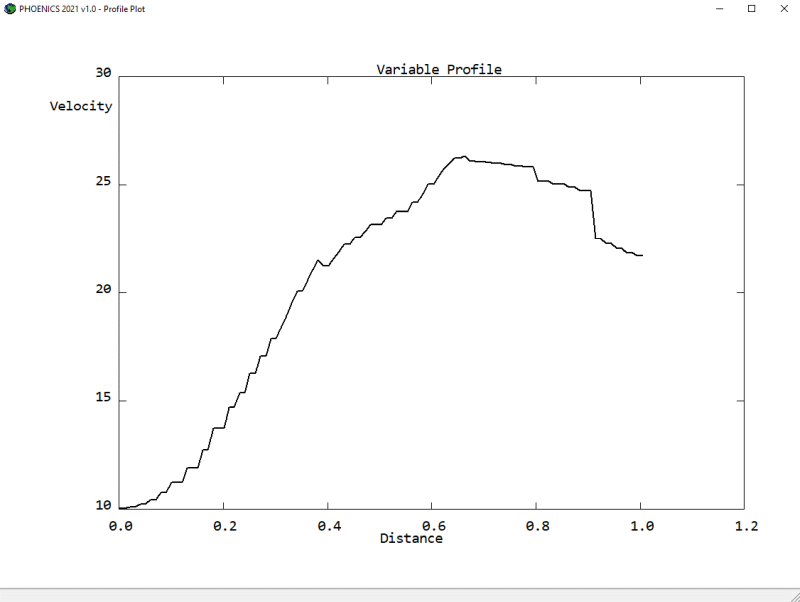
Figure 17g: Pressure along the selected line
Screen images such as figures 17a - g can be sent directly to a printer by clicking on 'File', then on 'Print' from the main environment screen. A dialog similar to that shown in figure 18a opens.
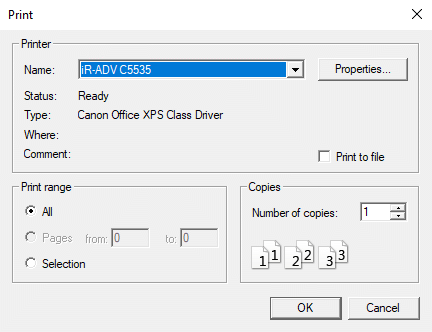
Figure 18a 'Print' Dialog Box
Alternatively, the screen image can be saved to a file by clicking on 'File', then on 'Save window as' from the main environment screen.
When 'Save window as' has been pressed, the dialog box shown in figure 18b opens.
Figure 18b 'Save Window as' Dialog Box
The 'Save as file' dialog offers a choice between GIF, PCX, BMP and JPG file formats, and allows the image to be saved with a higher (or lower) resolution than the screen image.
The graphics files are dumped in the selected folder (directory), with the given name. In all cases, the background colour of the saved image is that selected from 'Options', 'Background colour' from the VR-Editor main environment screen.
Before experimenting further, attention should be paid to the following: Any changes made in the VR Editor will overwrite the input files. Likewise any re-runs of the EARTH solver will overwrite the output files. Therefore you may want to save these files more permanently.
To accomplish this, click on 'File' then on 'Save as a case'. This opens the dialog window shown in figure 19.
Figure 19 'Save as a case' Dialog Box
All the files associated with the current simulation are copied into the selected folder, using the case name (entered into the File name data entry box) as a base to which suitable extensions are added.
To save the files for the example, create a new folder 'myproj', and save the files with the case name 'case1'.
This completes a simple simulation. The VR-Editor can be explored further by following the second example.
To quit the VR Viewer and return to the VR Editor, click on 'Run', then 'Pre processor' then 'GUI Pre processor (VR Editor)'.
In order to activate the calculation of a temperature field in the flow domain the following actions must be performed:
To do this, activate the VR Editor and follow this procedure:
In the VR Editor, Click on 'Main Menu'.
Click on 'Models'.
Switch 'Energy Equation' to 'ON' and select 'Temperature'.
Click on 'OK'.
Click on 'Properties'.
Click on Domain material: 'The current domain material is' dialog box.
Click on 'Gases', then on 'OK'.
Click on 'Air using Ideal Gas Law, STP'.
Check that 'Initialise from ambient' is turned ON. This will ensure that the initial temperature will always be set to whatever value is in the 'Ambient temperature' input box. Similarily, the initial pressure will always be taken from the 'Ambient pressure' input box. This value is relative to the Reference pressure, which is defaulted to 1 atmosphere.
Click on 'OK'.
Click on 'Initialisation'
The FIINIT Value dialog Boxes for the variables P1 (pressure) and TEM1 (temperature) are both set to AMBIENT, and are greyed out.
Click on 'Numerics'. Increase the number of iterations to 500.
Click on 'Relaxation control'. The Automatic Convergence Control is based on a typical velocity. We will be reducing the inlet velocity from 10 m/s to 0.1 m/s so the default value is no longer appropriate. Reset the 'reference velocity' to 0.1, then click 'Previous panel'.
Click on 'Top menu'.
Click on 'OK'.
Now the model has been set up for the calculation of temperature in the flow domain. However, a heat source should be introduced into the existing simulation in order to create differences of temperature. To do this:
Click on the image of the Inlet object twice; click on 'Attributes'; the inlet temperature is set to 'Ambient', with a value of 20°C. The supply pressure is also 'Ambient', with a value of 0 Pa relative to 1atm. Should we wish a different value for either, we can toggle 'Ambient' to 'User' and input any other value.
Reduce the velocity in the x-direction dialog box to 0.1 m/s, so as to increase the effective heat transfer of the simulation. Close the object dialog box.
Click on the image of the Outlet object twice; click on 'Attributes'; the External temperature is set to 'User-set', and value is 'Ambient' 20° C. The external pressure is 'Ambient',with a value of 0 Pa relative to 1atm. Should we wish a different value for either, we can toggle 'Ambient' to 'User' and input any other value. Close the object dialog box.
Click on the fence object twice; click on 'Attributes'; click on 'Energy source', then on 'Fixed Heat Flux', then on 'OK'. Now enter '500' in the Value dialog box. Close the object dialog box. The image of the fence should turn red, to indicate that a heat source is attached to this object.
Now the simulation can be re-run with the addition of heat transfer in the calculations. To do this:
Choose Solver from the PHOENICS-VR environment Run menu, and confirm running Earth when prompted.
Once the Earth run has finished, return to the VR Viewer by clicking 'VR Viewer' from the PHOENICS-VR environment Run menu.
The VR Viewer can now be used as before to display the temperature results. In figure 20, a contour plot of the temperature field is shown. Note that the temperatures can also be shown inside blocked regions as these participate in the heat transfer.
Figure 20: Example of temperature contours.
In this case, the fence object is hiding the temperature field inside itself. To make the temperature visible, click on the fence object to select it; then right-click and select 'Object wireframe' from the context menu. The effect of this is shown in figure 21.
Figure 21: Example of temperature contours in Wire frame
The heat and mass balance can be checked by looking at the sums of nett sources printed in the RESULT file. To view this, click 'File','Open file for editing','Result (Output file)'. Once RESULT has opened in the file editor, scroll down to the section headed 'Sources and Sinks'. Here all the sources and sinks from all the boundary conditions for all the variables are reported. The units of the printed sources are mass_per_unit_time * variable, i.e. a flux.
Typically the units of the sources are:
Mass sources are reported as sources of R1, and energy sources as source of TEM1.
 Nett source of R1   at patch named: OB5      (DOM_XMIN_I  ) = 6.024689E-02
 Nett source of R1   at patch named: OB6      (DOM_XMAX_O  ) =-6.024685E-02 (Mass Out -6.439324E-02 In 4.146372E-03)
 pos. sum=0.060247 neg. sum=-0.060247
 nett sum=4.470348E-08

 Nett source of TEM1 at patch named: OB5      (DOM_XMIN_I  ) = 1.772295E+04 (Average  2.000079E+01)
 Nett source of TEM1 at patch named: OB6      (DOM_XMAX_O  ) =-1.822090E+04 (Ave Out  2.770267E+01 In  2.000000E+01)
 Nett source of TEM1 at patch named: OC1      (FENCE       ) = 5.000006E+02
 pos. sum=1.822295E+04 neg. sum=-1.82209E+04
 nett sum=2.050781
From the extract above, we can see that the mass balance (nett sum for R1) is near enough zero. The energy balance shows an error of 2W, which is 0.01% of the total energy inflow.
The printout shows that at the exit (DOM_XMAX_O) air is entering as well as leaving, implying that there are recirculation zones at the exit plane. We can tell this because 'Mass in' and 'out' are both non-zero.
We can also see that the average temperature of the air entering (at DOM_XMIN_I) is 20°C as expected. At the exit, the average outflow temperature is 27.2°C.
In this section, the computational grid distribution will be adjusted in the x and y directions.
To view the flow domain regions and existing grid, follow the instructions below:
Click on the 'Mesh toggle' on the hand set to view the following:
The orange lines divide the x-direction into 5 regions and the y-direction into 7 regions; see figure 22. The blue lines are the remaining grid lines. The default grid is non-uniform in each region, maintaining a smooth change in mesh size at region boundaries. The mesh is displayed at the probe position (in this case at Z=0.5m), in the plane which is nearest to being perpendicular to the view direction.

Figure 22: Display of regions in the domain.
The grid will now be modified. There are three ways of adjusting the grid:
Each of these will be demonstrated.
Interactive adjustment
Right-click anywhere on the mesh. The interactive auto-meshing dialog will appear as shown
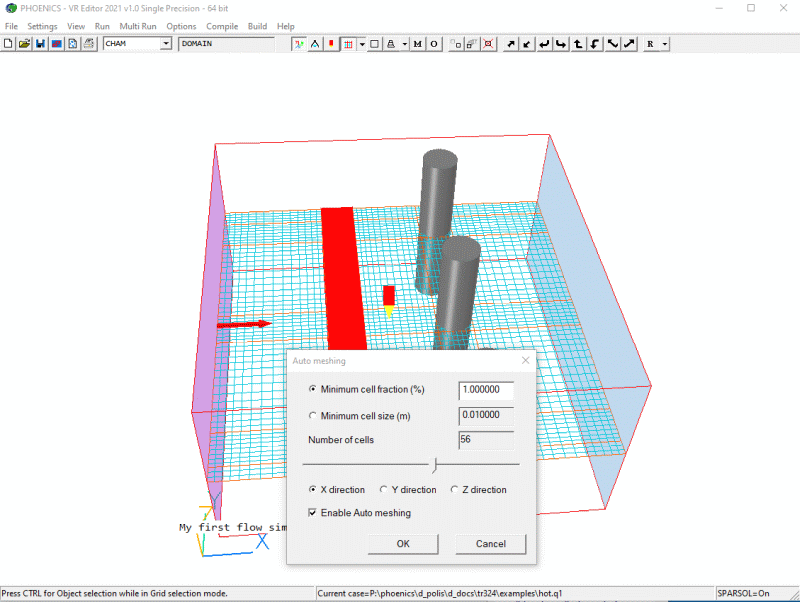
Figure 22a: Automesher dialog.
By default, the X direction is selected. Move the slider to the right, and the grid will get progressively coarser in the X direction:
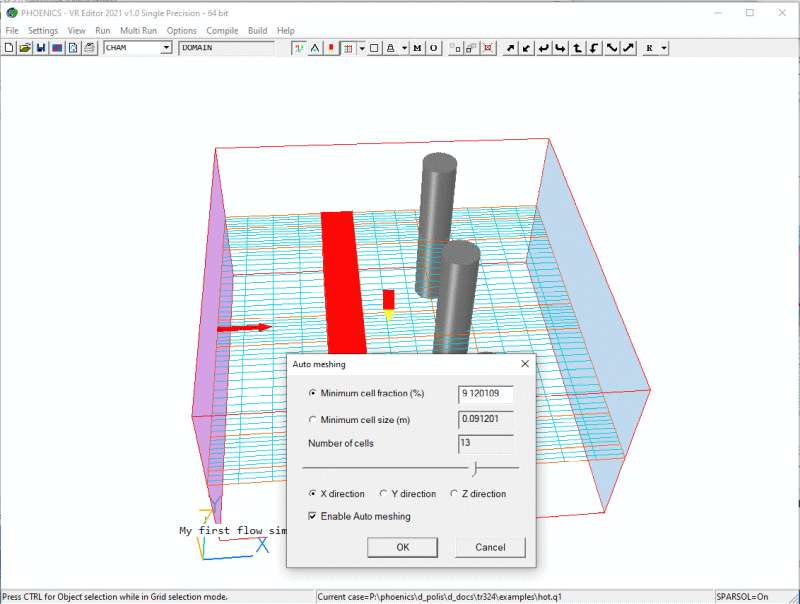
Figure 22b: Automesher coarse X grid.
Move the slider to the left, and the grid will get progressively finer in the X direction.
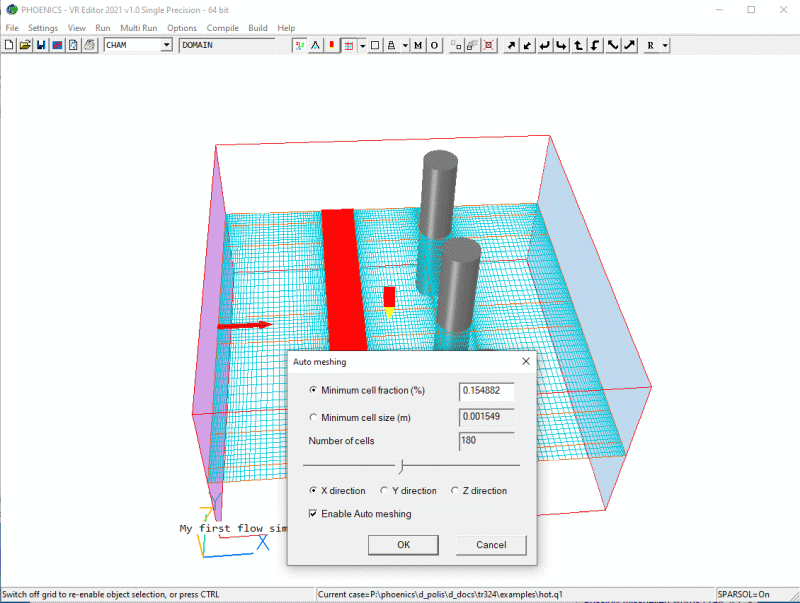
Figure 22c: Automesher fine X grid.
To adjust the grid the other direction, use the radio buttons to switch direction. To see the grid in the third direction, tilt the view to look more along the -Y axis. The grid display will change to show the X-Z grid.
The grid is changing in response to changing the Minimum cell fraction as a % of the domain size in that direction or the Minimum cell size allowed. It is not possible to enter an exact number of cells, as this is the result of an iterative process.
To undo the changes, press 'Cancel'
Manually adjusting the Auto-mesh parameter
Left-click anywhere in the grid to bring up the Grid mesh Settings dialog:
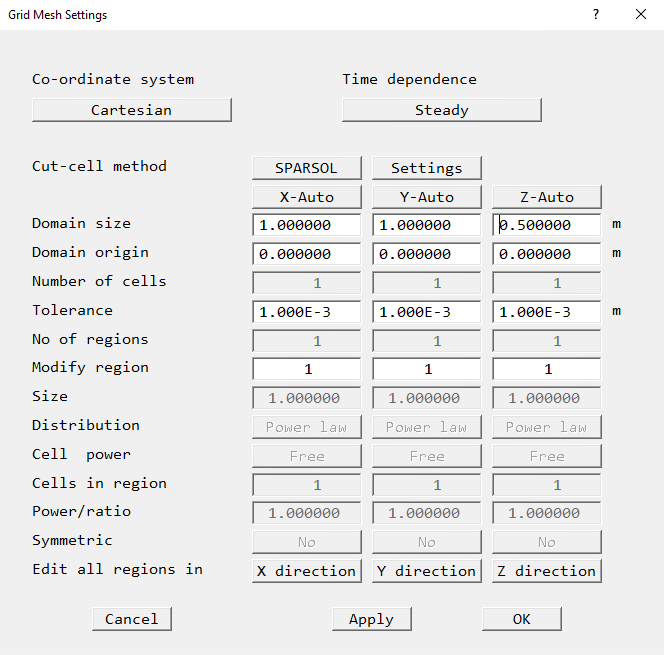
Figure 22d: Grid Mesh Settings dialog.
To adjust the grid in X, click 'X-direction' next to 'Edit all regions in X'. Similarly for Y and Z.
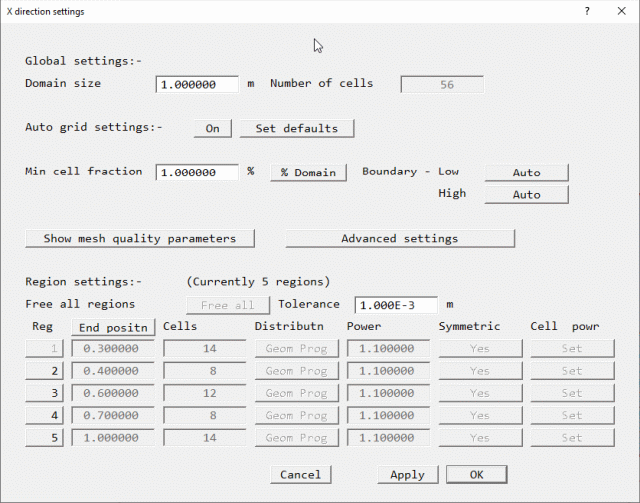
Figure 23: Manual Automesh adjustment dialog.
The minimum cell fraction can now be set. To switch to a physical size, click the '% domain' button and it will change to 'Size'. Entering a value and clicking 'Apply' will recompute the mesh distribution. The grayed out boxes will update to show the current values and the screen image will update to display the current grid.
Manually setting the grid by region
On the Grid Direction Setting dialog, click 'On' next to 'Auto mesh settings:- to turn the auto-mesher off. The grayed out region settings will become active as shown.
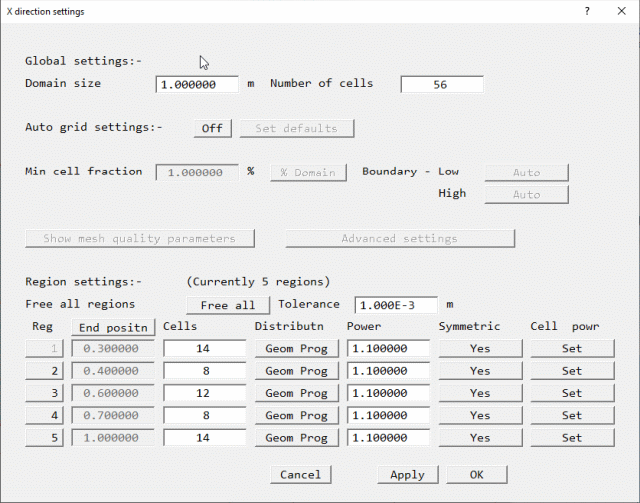
Figure 23a: Edit All Regions in X Dialog Box
In the x-direction the grid will be adjusted manually going from the left of the picture to the right, in the positive x-direction as follows,
Change the settings for each region as shown in Figure 23b:
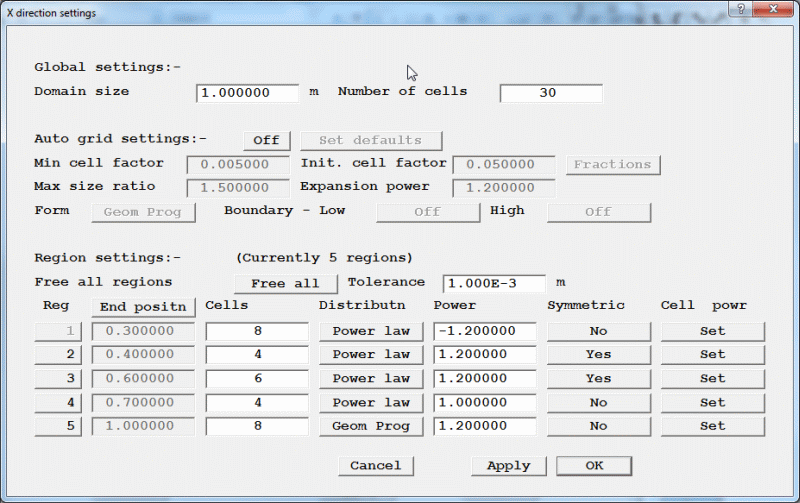
Figure 23b: Modified Edit All Regions in X Dialog Box
Click 'OK' to close this dialog, then 'OK' to close the Grid Mesh Settings dialog.
The grid distribution in the x and y directions should now appear as shown in Figure 24.
Figure 24: Display of refined grid in the x and y directions.
You should relate what has just been done within each region to the grid distribution created.
The desired computational grid modifications are now complete. To complete this new simulation, re-run EARTH as before by clicking on 'Run' then 'Solver'.
On completion of the simulation, the temperature field can be viewed as before using the VR Viewer by ;
From the PHOENICS-VR environment:
Click on 'Run', then 'VR Viewer'.
Click on the 'select temperature' button.
Click on the 'contour toggle'.
You are now encouraged to answer the following questions: Does the new grid affect the speed of convergence of the calculations? Does the new grid affect the temperature field found in the flow simulation?
The examples which have been worked through in this document demonstrate only a few of the many facilities available to the user in PHOENICS-VR environment and VR Editor/Viewer. This section lists where to obtain more information on these interfaces.
Bubble-help in VR Editor/Viewer handset.
In VR Editor and VR Viewer, information on the various handset control buttons can be displayed when the cursor is held stationary over any relevant control button.
Help in the Main Menu of the VR Editor and Object dialog boxes.
The following additional on-line help is available in the Main Menu of the VR Editor:
Click on the 'Help' button in the top menu for help on the Main Menu.
Click on the '?' in the top-right corner of any dialog box, then click on any input window or button to get information on the parameter which is set in it.
VR tutorials.
'POLIS' is the PHOENICS On-Line Information System. In POLIS, there are several tutorials, which are all written in a similar step-by-step fashion to this document. They can be accessed on-line by:
From the PHOENICS-VR environment,
click Help, then General Tutorials
Alternatively, click Help, then POLIS.
Click on How to Learn
click on The VR Tutorials
HELP Button on VR-Environment Top menu.
The Help button on the Help menu leads directly to the documentation section of POLIS. The POLIS button leads to the top page of POLIS.
TR/326 PHOENICS-VR Reference Guide
This document contains descriptions of all the menus and dialog boxes available in PHOENICS-VR.
Information about PHOENICS in general can be accessed from the PHOENICS-VR environment by:
Click Help, then POLIS.
Click on the entry 'PHOENICS Overview'.
More information, including tutorials and examples, is available from the PHOENICS Commander
Figure 1. The geometry to be created
Figure 2: The PHOENICS-VR Environment
screen
Figure 2a. The file menu
First example:
Figure 3a: Movement controls of
the VR Editor Hand Set
Figure 3b: Main controls of the VR
Editor hand set
Figure 4. The top data-input menu
Figure 5. Domain settings
Figure 6: The 'Models' page of the
Main Menu.
Figure 7: The 'Turbulence Models' page
of the Main Menu
Figure 8: The domain with its size set.
Figure 9: The Object dialog Box.
Figure 10: The fence object.
Figure 11: The fence and cylinder
objects.
Figure 12: The three cylinder objects.
Figure 12a: The three cylinder objects
grouped.
Figure 13: The array of cylinders moved
to new position.
Figure 14: An example of an EARTH run
screen.
Figure 15: The VR Viewer screen for
this case .
Figure 16: The viewing controls of
the VR Viewer hand set .
Figure 17a: A typical vector plot.
Figure 17b: A typical contour plot .
Figure 17c: A typical iso-surface.
Figure 17d: Surface Contour of
Velocity
Figure 17-st: Streamline options
Figure 17e: A Circle of Streamlines
Figure 17f: The 'Graph options' dialog
Figure 17g: Figure 17g: Velocity along the
selected line
Figure 18a 'Print' Dialog Box
Figure 18b 'Save Window as' Dialog Box
Figure 19 'Save as a case' Dialog
Box
Second example:
Figure 20: Example of temperature
contours.
Figure 21: Example of temperature
contours in Wire frame
Third example:
Figure 22: Display of regions in the
domain.
Figure 23: Grid Mesh Settings Dialog
Box
Figure 24: Display of modified grid in
the x-direction.