Hackney Central Hall Ventilation Studies
1. Overview
As part of a refurbishment of Hackney Central Hall, a large building
in London, an analysis of the heating and ventilation system was
undertaken. The main aim was to gain understanding of the degree
to which the temperature in the main auditorium was controlled by
each of the ventilation mechanisms. This information enabled the
HVAC energy to be utilised more efficiently while ensuring occupant
comfort levels. The work was undertaken by CHAM, in conjunction
with the consulting engineers for the work.
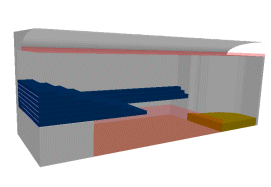 In the absence of CAD files for the building, a simple but realistic
geometrical representation was built up from architectural drawings,
using standard shapes assembled using the PHOENICS VR interface.
The hall is 33m ´ 22.8m
´ 12.7m (height) in size, but to
reduce computation times, thereby enabling a large number of
parameterised simulations to be undertaken, only half of the
nearly-symmetric chamber was include in the computations. The
main feature of the hall is the balcony at the back and sides,
which exerts a strong influence on the air flow. The
semi-transparent objects in the figure represent the heat sources
associated with people in the body of the hall and lighting below
the ceiling.
The hall is used in a number of different ways, and the ventilation
needs the flexibility to work well (and efficiently) in all of them.
Two main modes were considered: concert (or unamplified) and rock
(or amplified). In concert mode the HVAC system provides cooling
air at the rear of the hall in two ways; vents below the balcony
provide a supply to the lower floor, while the balcony has a
low-flow mechanism under the seats. In rock mode more people can
be accommodated and additional low level displacement terminals are
provided within wall panels below the side balconies. Air is
removed by natural convection from a line of vents along the centre
of the ceiling.
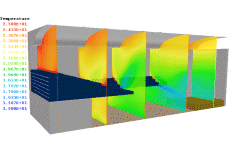
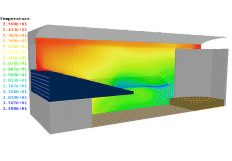
The figures show visualisations from one simulation. In this case
the under-seat air supply is active in the rear balcony, at a
temperature of 18ºC; cooler (12ºC) air is provided along the side
of the auditorium from under-balcony vents and from a larger wall
panel. Heat is produced by the people in the lower auditorium and
the balconies, at an assumed rate of 145W/m2; the lights
produce heat at a rate of 50W/m2 and 25W/m2,
above the stage and the public area respectively.
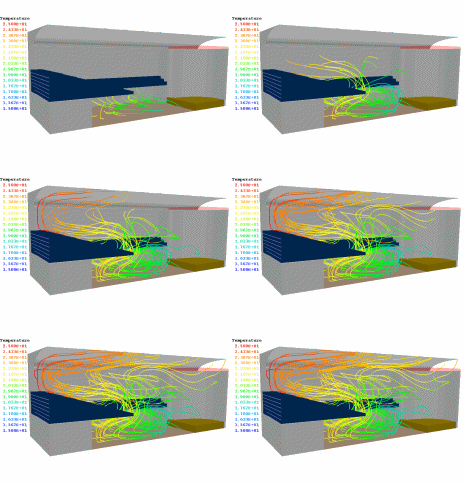
The results show the consequence of the lack of ventilation below
the rear balcony. A significant circulation zone is created,
drawing the air from the region in front of the stage which then
flows over the rear balcony before reaching the high-level vents.
This in turn twists the cool air ‘curtain’ from the side ventilation
panels, reinforcing the circulation. Temperatures are generally
acceptable in the occupied areas, including the stage which is,
if anything, cooled too much.
The PHOENICS simulations enabled a good understanding of the air
flow in the hall to be obtained, under a wide range of different
occupancy levels. The capacity of the ventilation to deal with
these conditions could be investigated, and appropriate settings
devised for each.
2. Technical Summary
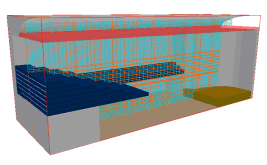 Hackney Central Hall is a large auditorium, 33m
´ 22.8m ´ 12.7m (height).
The main features of the geometry were constructed using standard
solid shapes, superimposed on a Cartesian grid. The grid chosen was
60 ´ 20 ´
78 (modelling half of the hall), providing sufficient
accuracy to capture the most important aspects of the air flow and
heat transfer. The balcony was constructed from rectangular blocks,
but these do not represent precisely the number of different levels
actually present.
Small gaps between the blocks in the rear balcony enabled the
under-seat air supplies to be easily positioned at the edge of the
domain; these vents supply 0.7m3/s of low-speed air at
18ºC. A long wall panel on the side wall, below the balcony,
provides about 2.5m3/s at a speed of 3m/s and a
temperature of 12ºC. Air leaves the hall via a line of ten vents
along the centre of the ceiling, each 0.5m
´ 0.25m; these were treated as fixed pressure
Heat sources were included, representing people and lighting.
These sources were applied directly to the air in appropriate
locations; it would have been possible to include solid
obstructions as well, but this was not considered necessary
in this study. Assumed rates of 145W/m2, representing
people, and 50W/m2 and 25W/m2, above the
stage and the public area respectively, representing the lights.
The solid walls and other structures were treated as non-participating
in the simulations. In reality, there will be some heat loss from
the air in the auditorium by this route, so the assumption can be
regarded as equivalent to considering the worst-case conditions.
The simulation was steady-state and incorporated buoyancy and turbulence.
Buoyancy was based on density difference, with the air being treated
as an ideal gas. The k-ε turbulence model was used in the
simulations; in view of the comparatively low temperatures, no buoyancy
adjustment was included in the model.
Click here for animated temperature contours
or
here for animated streamlines.
 In the absence of CAD files for the building, a simple but realistic
geometrical representation was built up from architectural drawings,
using standard shapes assembled using the PHOENICS VR interface.
The hall is 33m ´ 22.8m
´ 12.7m (height) in size, but to
reduce computation times, thereby enabling a large number of
parameterised simulations to be undertaken, only half of the
nearly-symmetric chamber was include in the computations. The
main feature of the hall is the balcony at the back and sides,
which exerts a strong influence on the air flow. The
semi-transparent objects in the figure represent the heat sources
associated with people in the body of the hall and lighting below
the ceiling.
